Setup
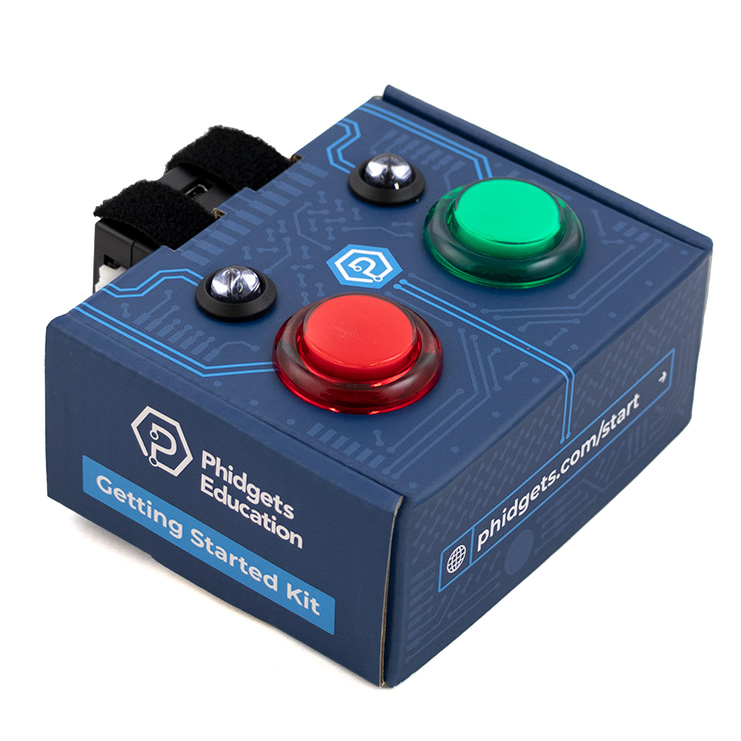
Before getting started, make sure you have the following parts.
Step 1
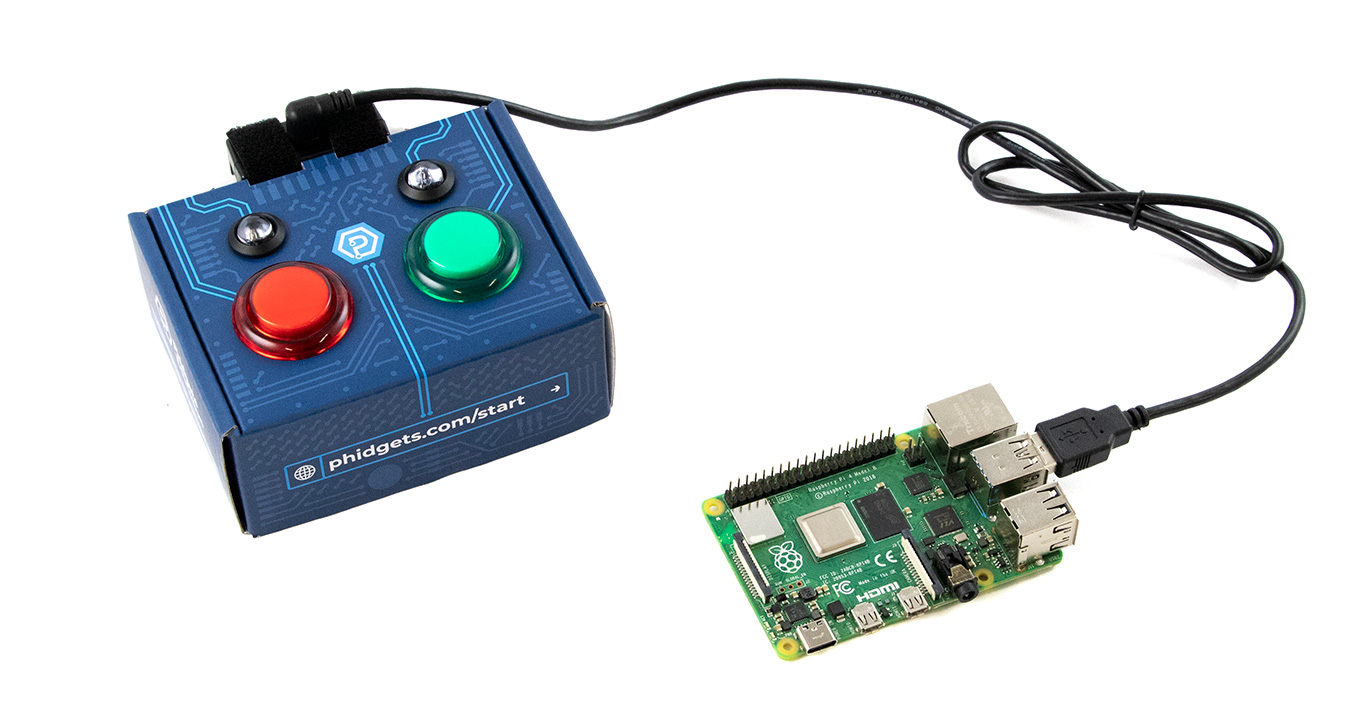
Simply connect your Getting Started Kit to your Raspberry Pi. Note: make sure your Humidity Phidget is connected (not shown in image).
If you haven't set up your Raspberry Pi with Phidgets yet, visit this project.
Review
In the previous project, you installed a web server on your Raspberry Pi and modified your website. If you have not completed the previous project, check it out now.
Displaying Sensor Data
There are two ways to display sensor data on your website:
- Write a program on your Raspberry Pi that logs sensor data to a file. Open the file from your website and display the data.
- Access sensors directly from your web page using the Phidget22 Javascript API.
For now, we will simply access a data file. Be on the lookout for future projects that use the Javascript API.
Write Code
Copy the code below into a new Python project. If you need a reminder of how to do this, revisit the Getting Started Course.
#Add Phidgets library
from Phidget22.Phidget import *
from Phidget22.Devices.TemperatureSensor import *
from Phidget22.Devices.DigitalOutput import *
#Required for sleep statement
import time

#Create
temperatureSensor = TemperatureSensor()
statusLED = DigitalOutput()

#Address
statusLED.setHubPort(1)
statusLED.setIsHubPortDevice(True)

#Open
temperatureSensor.openWaitForAttachment(1000)
statusLED.openWaitForAttachment(1000)

#Use your Phidgets
while (True):
    #Write data to file in CSV format
    with open ('/var/www/html/data.csv','a') as datafile:
        datafile.write(str(temperatureSensor.getTemperature()) + "\n")
    #Blink LED
    statusLED.setState(not statusLED.getState())

    time.sleep(1.0)
Run your program. You will see the red LED on your Getting Started Kit blink, indicating the program is running.
Modify Your Website
Overwrite your index.html file with the following:
<!doctype html>
<html lang="en">
<head>
    <meta charset="utf-8">
    <title>Phidgets</title>
</head>
<script>
    function connectPhidgets(){
        fetch('data.csv')
        .then(response => response.text())
        .then(text => {
            var data = text.split("\n");
            document.getElementById("dataLabel").innerHTML = data[data.length - 2] + "°C";
        })
    }
</script>
    <body onload="connectPhidgets()">
        <div>
            <h1>Phidget Data</h1>
            <h2 id="dataLabel">?</h2>
        </div>
    </body>
</html>
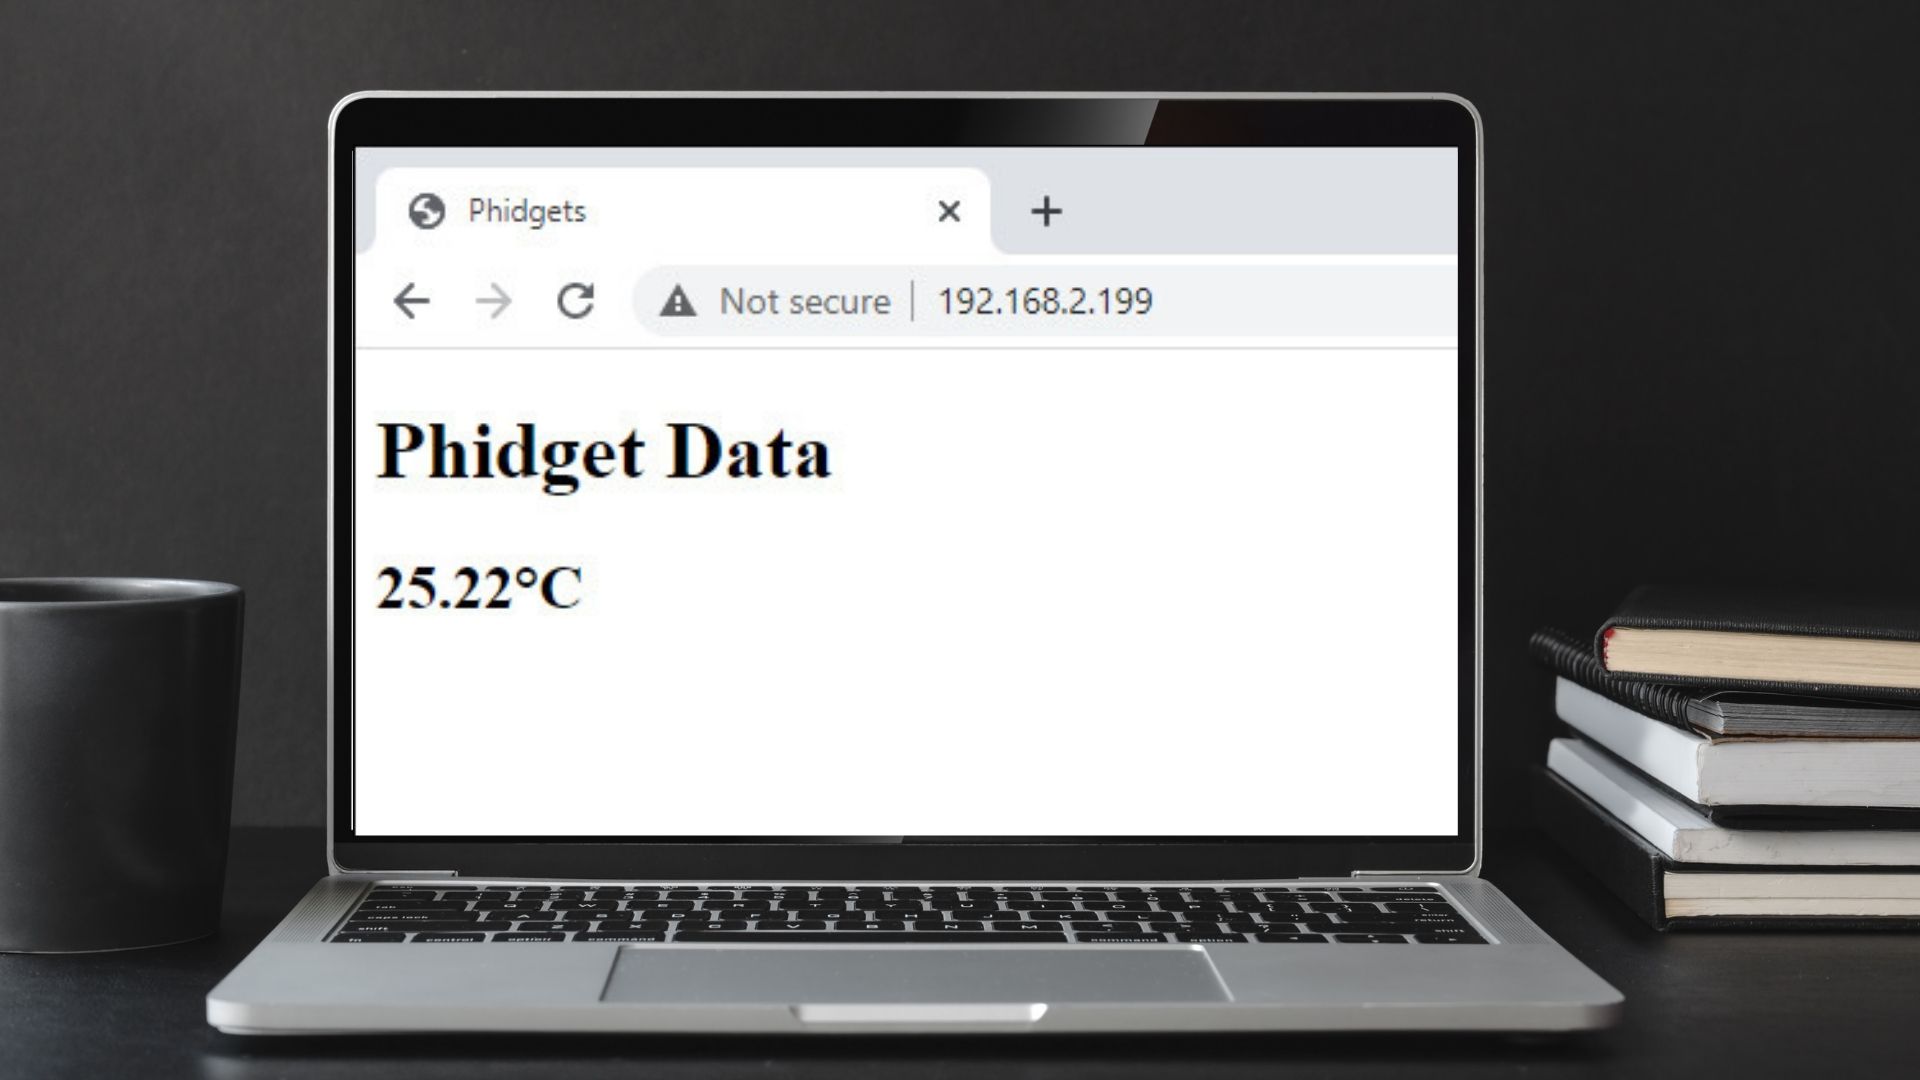
JavaScript code has been added to your web page. This code runs in the browser when the website is opened. The function connectPhidgets will run when the webpage loads. It will grab data from your data file and display the latest reading on your website.
Practice
- Configure your Python file to run on boot. Use this project as a reference.
- Modify your web page code to continually grab the newest value from your data file.
Next Steps
When you are comfortable with how the web page works, move on to the continuation of this project: Display Graph on Website


