Setup
Before getting started, make sure you have the following parts.
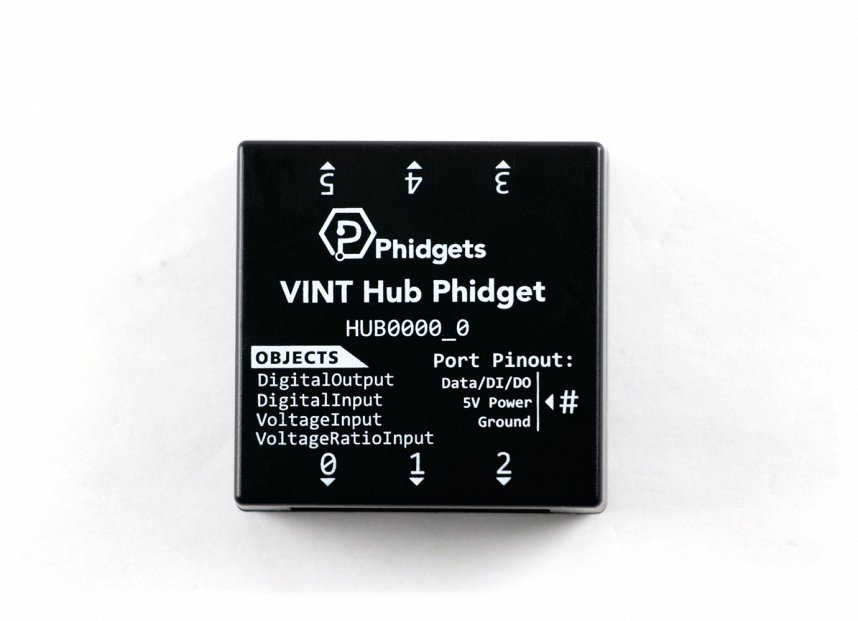
VINT Hub
Graphing Library (Java)
Copy the code below into a new Java file called LCDPlot.java
Not your programming language? Set your preferences so we can display relevant code examples
import java.io.FileWriter;
import java.text.DecimalFormat;
import java.time.LocalDateTime;
import java.time.format.DateTimeFormatter;
import java.util.ArrayList;
import java.util.Collections;

import com.phidget22.LCD;
import com.phidget22.LCDFont;

public class LCDPlot {

    private static ArrayList data = new ArrayList();
    private ArrayList pixelData = new ArrayList();
    private DecimalFormat df = new DecimalFormat("0.0");
    private static int numPoints;
    private double maxTemp = 0;
    private double minTemp = 0;
    private LCD lcd;
    private boolean recordData;
    private Record writeData;
    private int LCD_WIDTH = 127;
    private int Graph_WIDTH = 107;
    private int Graph_HEIGHT = 45;

    public LCDPlot() {
    }

    ;

	// Constructor that records the data passed by user
	public LCDPlot(int dataPoints, boolean recordData) throws Exception {

        numPoints = dataPoints;
        lcd = new LCD();
        lcd.open(1000);
        lcd.setBacklight(0.5); // Enable backlight

        this.recordData = recordData;

        if (recordData) {
            writeData = new Record();
        }
    }

    // Main function that runs all the other functions
    public void start() throws Exception {

        if (recordData) {
            writeData.writeValue();
        }

        display();
        yScaling();
        xScaling();
        graph();

    }

    // Gets temp from temperature sensor and records in array
    public void addDataPoint(double num) throws Exception {

        // Limits array size to the number of points displayed on the screen
        if (data.size() >= numPoints) {
            data.remove(0);
        }

        data.add(num);
        start();
    }

    // Displays elements of graph
    private void display() throws Exception {

        // This initializes the graph axis
        lcd.drawLine(20, 11, 20, 56);
        lcd.drawLine(20, 56, 127, 56);

        maxTemp = Collections.max(data);
        minTemp = Collections.min(data);

        // Writes Max, Min and Current Temp
        lcd.writeText(LCDFont.DIMENSIONS_5X8, 1, 1, "Min: " + String.valueOf(df.format(minTemp)));
        lcd.writeText(LCDFont.DIMENSIONS_5X8, 51, 1, "Max: " + String.valueOf(df.format(maxTemp)));
        lcd.writeText(LCDFont.DIMENSIONS_6X12, 101, 1, String.valueOf(df.format(data.get(data.size() - 1))));
    }

    // Auto scales y-axis
    private void yScaling() throws Exception {

        Double temp = Collections.max(data);
        Double scale = ((maxTemp - minTemp) / 5);

        // Draws ticks and numbers | Starts on pixel 11 and moves down 9 pixels at a
        // time. At each increment, a small visible line is drawn to indicate the
        // location as well as a numeric value is printed out on the screen.
        for (int i = 11; i <= 56; i += 9) {
            lcd.drawLine(20, i, 21, i);
            lcd.writeText(LCDFont.DIMENSIONS_5X8, 0, i, Double.toString(Double.valueOf(df.format(temp))));
            temp -= scale;
        }

    }

    // Auto scales x-axis
    private void xScaling() throws Exception {

        // Draws ticks on x-axis |The graph starts at pixel 20, and draws a vertical
        // tick of width 2 across the x-axis for each data point
        int scale = Math.round(Graph_WIDTH / (numPoints - 1));

        for (int i = 20 + scale; i < LCD_WIDTH; i += scale) {
            lcd.drawLine(i, 56, i, 58);
        }

    }

    // Draws the graph
    private void graph() throws Exception {

        double range = maxTemp - minTemp;
        int scale = Math.round(Graph_WIDTH / (numPoints - 1));

        // Changes the pixel location of the data based on min and max data points |
        // Math: Let x be the pixel location of the data point. x/Graph_Height in pixels
        // = (data point - min temp)/temp range.
        // Solving for x will result in a ratio where the pixel location simulates the
        // distribution of the temperature
        for (int i = 0; i < data.size(); i++) {
            double pixel = 56 - (data.get(i) - minTemp) / range * Graph_HEIGHT;
            pixelData.add((int) Math.round(pixel));
        }

        // Temp 2 gives the pixel for the first time data point
        int temp2 = 20;

        // Graphs data | The LCD will draw a line between the pixel of the previous data
        // point and the current data point
        for (int i = 0; i < data.size(); i++) {
            if (i > 0) {
                lcd.drawLine(temp2 - scale, pixelData.get(i - 1), temp2, pixelData.get(i));
            }

            temp2 += scale;
        }

        pixelData.clear();
        lcd.flush();

        // Clears the space of the graph essential refreshing the screen every time a
        // new data point is added
        lcd.drawRect(21, 11, LCD_WIDTH, 55, true, true);
    }

    public void closeDevices() {
        try {
            // Close LCD so it isnt left on at the end of the program
            lcd.close();
        } catch (Exception e) {
            // This is a better way of handeling exceptions vs throwing them
            System.out.printf("Error when trying to close LCD:\n%s", e);
        }
    }

    // Records the temp into a file
    class Record extends LCDPlot {

        String name;
        FileWriter outfile;
        int count = 0;
        int counter = 0;

        public Record() throws Exception {

            DateTimeFormatter dtf = DateTimeFormatter.ofPattern("yyyy/MM/dd HH:mm:ss");
            LocalDateTime now = LocalDateTime.now();
            name = dtf.format(now);

            // Can't title files with "/" or ":" so they are replaced by "_" and "."
            name = name.replace("/", "_").replace(":", ".");
        }

        public void writeValue() throws Exception {

            // Creates a file writer to the csv file
            outfile = new FileWriter(name + ".csv", true);

            // If it is the first data point, then it titles the columns in excel file
            if (count == 0) {
                outfile.write("Data Points, Temperature \n");
            }

            // Count keeps track of what data point we are on | If count exceeds the total
            // numPoints (i.e. the number of points present in the data array) then we
            // control counter (the index on the most recent data point in the array) to be the last element
            // in the array
            if (count >= numPoints) {
                this.counter = numPoints - 1;
            }

            // Writes data point number and data value to excel file
            String num = Double.toString(data.get(this.counter));
            outfile.write(Integer.toString(count) + "," + num + "\n");

            count++;
            this.counter++;

            outfile.close();

        }
    }
}
package plotting;

import java.io.FileWriter;
import java.text.DecimalFormat;
import java.time.LocalDateTime;
import java.time.format.DateTimeFormatter;
import java.util.ArrayList;
import java.util.Collections;

import com.phidget22.LCD;
import com.phidget22.LCDFont;

public class LCDPlot {

    private static ArrayList data = new ArrayList();
    private ArrayList pixelData = new ArrayList();
    private DecimalFormat df = new DecimalFormat("0.0");
    private static int numPoints;
    private double maxTemp = 0;
    private double minTemp = 0;
    private LCD lcd;
    private boolean recordData;
    private Record writeData;
    private int LCD_WIDTH = 127;
    private int Graph_WIDTH = 107;
    private int Graph_HEIGHT = 45;

    public LCDPlot() {
    }

    ;

	// Constructor that records the data passed by user
	public LCDPlot(int dataPoints, boolean recordData) throws Exception {

        numPoints = dataPoints;
        lcd = new LCD();
        lcd.open(1000);
        lcd.setBacklight(0.5); // Enable backlight

        this.recordData = recordData;

        if (recordData) {
            writeData = new Record();
        }
    }

    // Main function that runs all the other functions
    public void start() throws Exception {

        if (recordData) {
            writeData.writeValue();
        }

        display();
        yScaling();
        xScaling();
        graph();

    }

    // Gets temp from temperature sensor and records in array
    public void addDataPoint(double num) throws Exception {

        // Limits array size to the number of points displayed on the screen
        if (data.size() >= numPoints) {
            data.remove(0);
        }

        data.add(num);
        start();
    }

    // Displays elements of graph
    private void display() throws Exception {

        // This initializes the graph axis
        lcd.drawLine(20, 11, 20, 56);
        lcd.drawLine(20, 56, 127, 56);

        maxTemp = Collections.max(data);
        minTemp = Collections.min(data);

        // Writes Max, Min and Current Temp
        lcd.writeText(LCDFont.DIMENSIONS_5X8, 1, 1, "Min: " + String.valueOf(df.format(minTemp)));
        lcd.writeText(LCDFont.DIMENSIONS_5X8, 51, 1, "Max: " + String.valueOf(df.format(maxTemp)));
        lcd.writeText(LCDFont.DIMENSIONS_6X12, 101, 1, String.valueOf(df.format(data.get(data.size() - 1))));
    }

    // Auto scales y-axis
    private void yScaling() throws Exception {

        Double temp = Collections.max(data);
        Double scale = ((maxTemp - minTemp) / 5);

        // Draws ticks and numbers | Starts on pixel 11 and moves down 9 pixels at a
        // time. At each increment, a small visible line is drawn to indicate the
        // location as well as a numeric value is printed out on the screen.
        for (int i = 11; i <= 56; i += 9) {
            lcd.drawLine(20, i, 21, i);
            lcd.writeText(LCDFont.DIMENSIONS_5X8, 0, i, Double.toString(Double.valueOf(df.format(temp))));
            temp -= scale;
        }

    }

    // Auto scales x-axis
    private void xScaling() throws Exception {

        // Draws ticks on x-axis |The graph starts at pixel 20, and draws a vertical
        // tick of width 2 across the x-axis for each data point
        int scale = Math.round(Graph_WIDTH / (numPoints - 1));

        for (int i = 20 + scale; i < LCD_WIDTH; i += scale) {
            lcd.drawLine(i, 56, i, 58);
        }

    }

    // Draws the graph
    private void graph() throws Exception {

        double range = maxTemp - minTemp;
        int scale = Math.round(Graph_WIDTH / (numPoints - 1));

        // Changes the pixel location of the data based on min and max data points |
        // Math: Let x be the pixel location of the data point. x/Graph_Height in pixels
        // = (data point - min temp)/temp range.
        // Solving for x will result in a ratio where the pixel location simulates the
        // distribution of the temperature
        for (int i = 0; i < data.size(); i++) {
            double pixel = 56 - (data.get(i) - minTemp) / range * Graph_HEIGHT;
            pixelData.add((int) Math.round(pixel));
        }

        // Temp 2 gives the pixel for the first time data point
        int temp2 = 20;

        // Graphs data | The LCD will draw a line between the pixel of the previous data
        // point and the current data point
        for (int i = 0; i < data.size(); i++) {
            if (i > 0) {
                lcd.drawLine(temp2 - scale, pixelData.get(i - 1), temp2, pixelData.get(i));
            }

            temp2 += scale;
        }

        pixelData.clear();
        lcd.flush();

        // Clears the space of the graph essential refreshing the screen every time a
        // new data point is added
        lcd.drawRect(21, 11, LCD_WIDTH, 55, true, true);
    }

    public void closeDevices() {
        try {
            // Close LCD so it isnt left on at the end of the program
            lcd.close();
        } catch (Exception e) {
            // This is a better way of handeling exceptions vs throwing them
            System.out.printf("Error when trying to close LCD:\n%s", e);
        }
    }

    // Records the temp into a file
    class Record extends LCDPlot {

        String name;
        FileWriter outfile;
        int count = 0;
        int counter = 0;

        public Record() throws Exception {

            DateTimeFormatter dtf = DateTimeFormatter.ofPattern("yyyy/MM/dd HH:mm:ss");
            LocalDateTime now = LocalDateTime.now();
            name = dtf.format(now);

            // Can't title files with "/" or ":" so they are replaced by "_" and "."
            name = name.replace("/", "_").replace(":", ".");
        }

        public void writeValue() throws Exception {

            // Creates a file writer to the csv file
            outfile = new FileWriter(name + ".csv", true);

            // If it is the first data point, then it titles the columns in excel file
            if (count == 0) {
                outfile.write("Data Points, Temperature \n");
            }

            // Count keeps track of what data point we are on | If count exceeds the total
            // numPoints (i.e. the number of points present in the data array) then we
            // control counter (the index on the most recent data point in the array) to be the last element
            // in the array
            if (count >= numPoints) {
                this.counter = numPoints - 1;
            }

            // Writes data point number and data value to excel file
            String num = Double.toString(data.get(this.counter));
            outfile.write(Integer.toString(count) + "," + num + "\n");

            count++;
            this.counter++;

            outfile.close();

        }
    }
}
Code not available for Processing.
Graphing Library (Python)
Copy the code below into a new Python file called LCDPlot.py
Not your programming language? Set your preferences so we can display relevant code examples
from Phidget22.Devices.LCD import *
from datetime import datetime


class LCDPlot:
    name = ""
    counting = 0
    count = 0
    data = []
    pixel_data = []
    num_points = 0
    max_temp = 0
    min_temp = 0
    lcd = LCD()
    record = True
    LCD_WIDTH = 127
    Graph_WIDTH = 107
    Graph_HEIGHT = 45

    # Constructor that self.self.records the self.self.data passed by user
    def __init__(self, dataPoints, record_data):

        self.lcd.openWaitForAttachment(1000)
        self.lcd.setBacklight(0.5)
        self.num_points = dataPoints
        self.record = record_data

        # Initializes the name of the file with date and time
        # Can't title files with "/" or ":" so they are replaced by "_" and "."
        if self.record:

            # Get current time when starting program
            # Used to name the csv file to which the data will be written to
            self.name = datetime.now().strftime("%m_%d_%Y %H.%M.%S")

    # Main function that runs all the other functions
    def start(self):

        if self.record:
            self.write_file()

        self.display()
        self.y_scaling()
        self.x_scaling()
        self.graph()

    # Gets temp from temperature sensor and records in array
    def add_data_point(self, num):

        # Limits array size to the number of points displayed on the screen
        if len(self.data) >= self.num_points:
            self.data.pop(0)

        self.data.append(num)
        self.start()

    # Displays elements of graph
    def display(self):

        # This initializes the graph axis
        self.lcd.drawLine(20, 11, 20, 56)
        self.lcd.drawLine(20, 56, 127, 56)

        self.max_temp = max(self.data)
        self.min_temp = min(self.data)

        # Writes Max, Min and Current Temp
        self.lcd.writeText(LCDFont.FONT_5x8, 1, 1, "Min: " + str(round(self.min_temp, 1)))
        self.lcd.writeText(LCDFont.FONT_5x8, 51, 1, "Max: " + str(round(self.max_temp, 1)))
        self.lcd.writeText(LCDFont.FONT_6x12, 101, 1, str(round(self.data[len(self.data) - 1], 1)))

    # Auto scales x-axis
    def x_scaling(self):

        # Draws ticks on x-axis |The graph starts at pixel 20, and draws a vertical
        # tick of width 2 across the x-axis for each data point
        scale = round(self.Graph_WIDTH / (self.num_points - 1))
        i = 20 + scale

        while i < self.LCD_WIDTH:
            self.lcd.drawLine(i, 56, i, 58)
            i += scale

    # Auto scales y-axis
    def y_scaling(self):

        temp = max(self.data)
        scale = ((self.max_temp - self.min_temp) / 5)

        # Draws ticks and numbers | Starts on pixel 11 and moves down 9 pixels at a
        # time. At each increment, a small visible line is drawn to indicate the
        # location as well as a numeric value is printed out on the screen.
        i = 11
        while i <= 56:
            self.lcd.drawLine(20, i, 21, i)
            self.lcd.writeText(LCDFont.FONT_5x8, 0, i, str(round(temp, 1)))
            temp -= scale
            i += 9

    # Draws the graph

    def graph(self):

        size = self.max_temp - self.min_temp
        scale = round(self.Graph_WIDTH / (self.num_points - 1))

        # Ensures that when there is only 1 data point the scale is not 0. | In this case, an arbitrary value for
        # the scale is set so the the pixel location formula will not divide by zero. This is auto adjusted
        # with more data points.
        if size == 0:
            size = 2

        # Changes the pixel location of the data based on min and max data points |
        # Math: Let x be the pixel location of the data point. x/Graph_Height in pixels
        # = (data point - min temp)/temp range.
        # Solving for x will result in a ratio where the pixel location simulates the
        # distribution of the temperature
        for i in range(len(self.data)):
            pixel = 56 - (self.data[i] - self.min_temp) / size * self.Graph_HEIGHT
            self.pixel_data.append(round(pixel))

        # Temp 2 gives the pixel for the first time data point
        temp2 = 20

        # Graphs data | The LCD will draw a line between the pixel of the previous data
        # point and the current data point
        for i in range(len(self.data)):
            if i > 0:
                self.lcd.drawLine(temp2 - scale, self.pixel_data[i - 1], temp2, self.pixel_data[i])
            temp2 += scale

        self.pixel_data.clear()
        self.lcd.flush()

        # Clears the space of the graph essential refreshing the screen every time a
        # new data point is added
        self.lcd.drawRect(21, 11, self.LCD_WIDTH, 55, True, True)

    # Records the temp into a file
    def write_file(self):

        # Creates a file writer to the csv file
        file = open(self.name + ".csv", "a")

        # If it is the first data point, then it titles the columns in excel file
        if self.count == 0:
            file.write("Data points" + "," + "Temperature \n")

        # Count keeps track of what data point we are on | If count exceeds the total
        # numPoints (i.e. the number of points present in the data array) then we
        # control counter (the index on the most recent data point in the array) to be the last element
        # in the array
        if self.counting >= self.num_points:
            self.counting = self.num_points - 1

        # Writes data point number and data value to excel file
        file.write(str(self.count) + "," + str(self.data[self.counting]) + "\n")

        self.count += 1
        self.counting += 1

        file.close()

    def close_objects(self):
        self.lcd.close()
Graphing Library (C#)
Copy the code below into a new C# file called LCDPlot.cs
Not your programming language? Set your preferences so we can display relevant code examples
using System;
using System.Collections.Generic;
using System.IO;
using System.Linq;
using Phidget22;

namespace Plotting
{
    class LCDPlot
    {
        public static List data = new List();
        static List pixelData = new List();
        public static int numPoints;
        double maxTemp;
        double minTemp;
        LCD lcd;
        Boolean recordData;
        Record writeData;
        int LCD_WIDTH = 127;
        int Graph_WIDTH = 107;
        int Graph_HEIGHT = 45;

        public LCDPlot()
        {

        }

        // Constructor that recrods data passed by user
        public LCDPlot(int dataPoints, Boolean recordData)
        {
            numPoints = dataPoints;
            lcd = new LCD();
            lcd.Open(1000);
            lcd.setBacklight(0.5);

            this.recordData = recordData;

            if (recordData)
                writeData = new Record();
        }

        // Main function that runs all other functions
        public void start()
        {
            if (recordData)
                writeData.writeData();

            Display();
            XScaling();
            YScaling();
            Graph();

        }

        // Gets temp from temp sensor
        public void addDataPoint(double num)
        {
            // Limits array size to the number of points displayed on the screen
            if (data.Count() >= numPoints)
                data.RemoveAt(0);

            data.Add(num);
            start();

        }

        //Displays elements of graph
        private void Display()
        {
            // This initializes the graph axis
            lcd.DrawLine(20, 11, 20, 56);
            lcd.DrawLine(20, 56, LCD_WIDTH, 56);

            maxTemp = data.Max();
            minTemp = data.Min();

            // Writes Max, Min and Current Temp
            lcd.WriteText(LCDFont.Dimensions_5x8, 1, 1, "Min: " + minTemp.ToString("0.0"));
            lcd.WriteText(LCDFont.Dimensions_5x8, 51, 1, "Max: " + maxTemp.ToString("0.0"));
            lcd.WriteText(LCDFont.Dimensions_6x12, 101, 1, data[data.Count - 1].ToString("0.0"));

        }

        // Scales x-axis
        private void XScaling()
        {
            double temp = Graph_WIDTH / (numPoints - 1);
            int scale = (int)Math.Round(temp);

            // Draws ticks on x-axis |The graph starts at pixel 20, and draws a vertical
            // tick of width 2 across the x-axis for each data point
            for (int i = 20 + scale; i 0)
                    lcd.DrawLine(temp2 - scale, pixelData[i - 1], temp2, pixelData[i]);

                temp2 += scale;
            }

            pixelData.Clear();
            lcd.Flush();

            // Clears the space of the graph essential refreshing the screen every time a
            // new data point is added
            lcd.DrawRectangle(21, 11, LCD_WIDTH, 55, true, true);
        }

    }

    // Records temp into a file
    class Record : LCDPlot{

        String name;
        int count = 0;
        int counter = 0;

        public Record()
        {
            name = DateTime.Now.ToString();

            // Can't title files with "/" or ":" so they are replaced by "_" and "."
            name = name.Replace("/", "_").Replace(":", ".");

        }


        public void writeData()
        {
            // Creates a file writer to the csv file
            StreamWriter sw = new StreamWriter(@name + ".csv", true);

            // If it is the first data point, then it titles the columns in excel file
            if (count == 0)
                sw.WriteLine("data points, temperature");

            // Count keeps track of what data point we are on | If count exceeds the total
            // numPoints (i.e. the number of points present in the data array) then we
            // control counter (the index on the most recent data point in the array) to be the last element
            // in the array
            if (count >= numPoints)
                counter = numPoints - 1;

            // Writes data point number and data value to excel file
            sw.WriteLine(count.ToString() + "," + data[counter].ToString());

            count++;
            counter++;

            sw.Close();

        }
    }
}
Write Code (Swift)
Code not available for Swift. Please set your preferences and select a new language.
Use the Graphing Library (Java)
Create a new Java project called Plotting and copy the code below into your project. If you need a reminder of how to do this, revisit the Getting Started Course.
Not your programming language? Set your preferences so we can display relevant code examples
//Add Phidgets Library
import com.phidget22.*;

public class Plotting {

    public static void main(String[] args) throws Exception {

        //Create
        TemperatureSensor temperatureSensor = new TemperatureSensor();

        //Open
        temperatureSensor.open(1000);

        //Create LCDPlot object
        //First argument refers to the number of data points displayed on the graph
        //Second argument indicates whether or not to store data to a file
        LCDPlot graph = new LCDPlot(10, true);

        //Use your Phidgets
        while (true) {
            graph.addDataPoint(temperatureSensor.getTemperature());
            Thread.sleep(temperatureSensor.getDataInterval());
        }
    }
}
package plotting;

//Add Phidgets Library
import com.phidget22.*;

public class Plotting {

    public static void main(String[] args) throws Exception {

        //Create
        TemperatureSensor temperatureSensor = new TemperatureSensor();

        //Open
        temperatureSensor.open(1000);

        //Create LCDPlot object
        //First argument refers to the number of data points displayed on the graph
        //Second argument indicates whether or not to store data to a file
        LCDPlot graph = new LCDPlot(10, true);

        //Use your Phidgets
        while (true) {
            graph.addDataPoint(temperatureSensor.getTemperature());
            Thread.sleep(temperatureSensor.getDataInterval());
        }
    }
}
Code not available for Processing.
Drag LCDPlot.java into your new project.
Use the Graphing Library (Python)
Copy the code below into a new Python script called plotting.py Not your programming language? Set your preferences so we can display relevant code examples
#Add Phidgets Library
from Phidget22.Devices.TemperatureSensor import *
#Required for LCD plotting
from LCDPlot import LCDPlot
#Required for sleep statement
import time

#Create
temperatureSensor = TemperatureSensor()

#Open
temperatureSensor.openWaitForAttachment(1000)

#Create LCDPlot object
#First argument refers to the number of data points displayed on the graph
#Second argument indicates whether or not to store data to a file
graph = LCDPlot(10, True)

#Use your Phidgets
while True:
    graph.add_data_point(temperatureSensor.getTemperature())
    time.sleep(temperatureSensor.getDataInterval()/1000)
You should now have both files in the same location.
Use the Graphing Library (C#)
Create a new C# project called Plotting and copy the code below into your class file. If you need a reminder of how to do this, revisit the Getting Started Course.
Not your programming language? Set your preferences so we can display relevant code examples
//Add Phidgets Library
using Phidget22;

namespace Plotting
{
    class Program
    {
        static void Main(string[] args)
        {
            //Create
            TemperatureSensor temperatureSensor = new TemperatureSensor();

            //Open
            temperatureSensor.Open(1000);


            //Create LCDPlot object
            //First argument refers to the number of data points displayed on the graph
            //Second argument indicates whether or not to store data to a file
            LCDPlot graph = new LCDPlot(12, true);


            //Use your Phidgets
            while (true)
            {
                graph.addDataPoint(temperatureSensor.Temperature);
                System.Threading.Thread.Sleep(temperatureSensor.DataInterval);

            }
        }
    }
}
Drag LCDPlot.cs into your new project.
Use the Graphing Library (Swift)
Code not available for Swift. Please set your preferences and select a new language.
Run Your Program
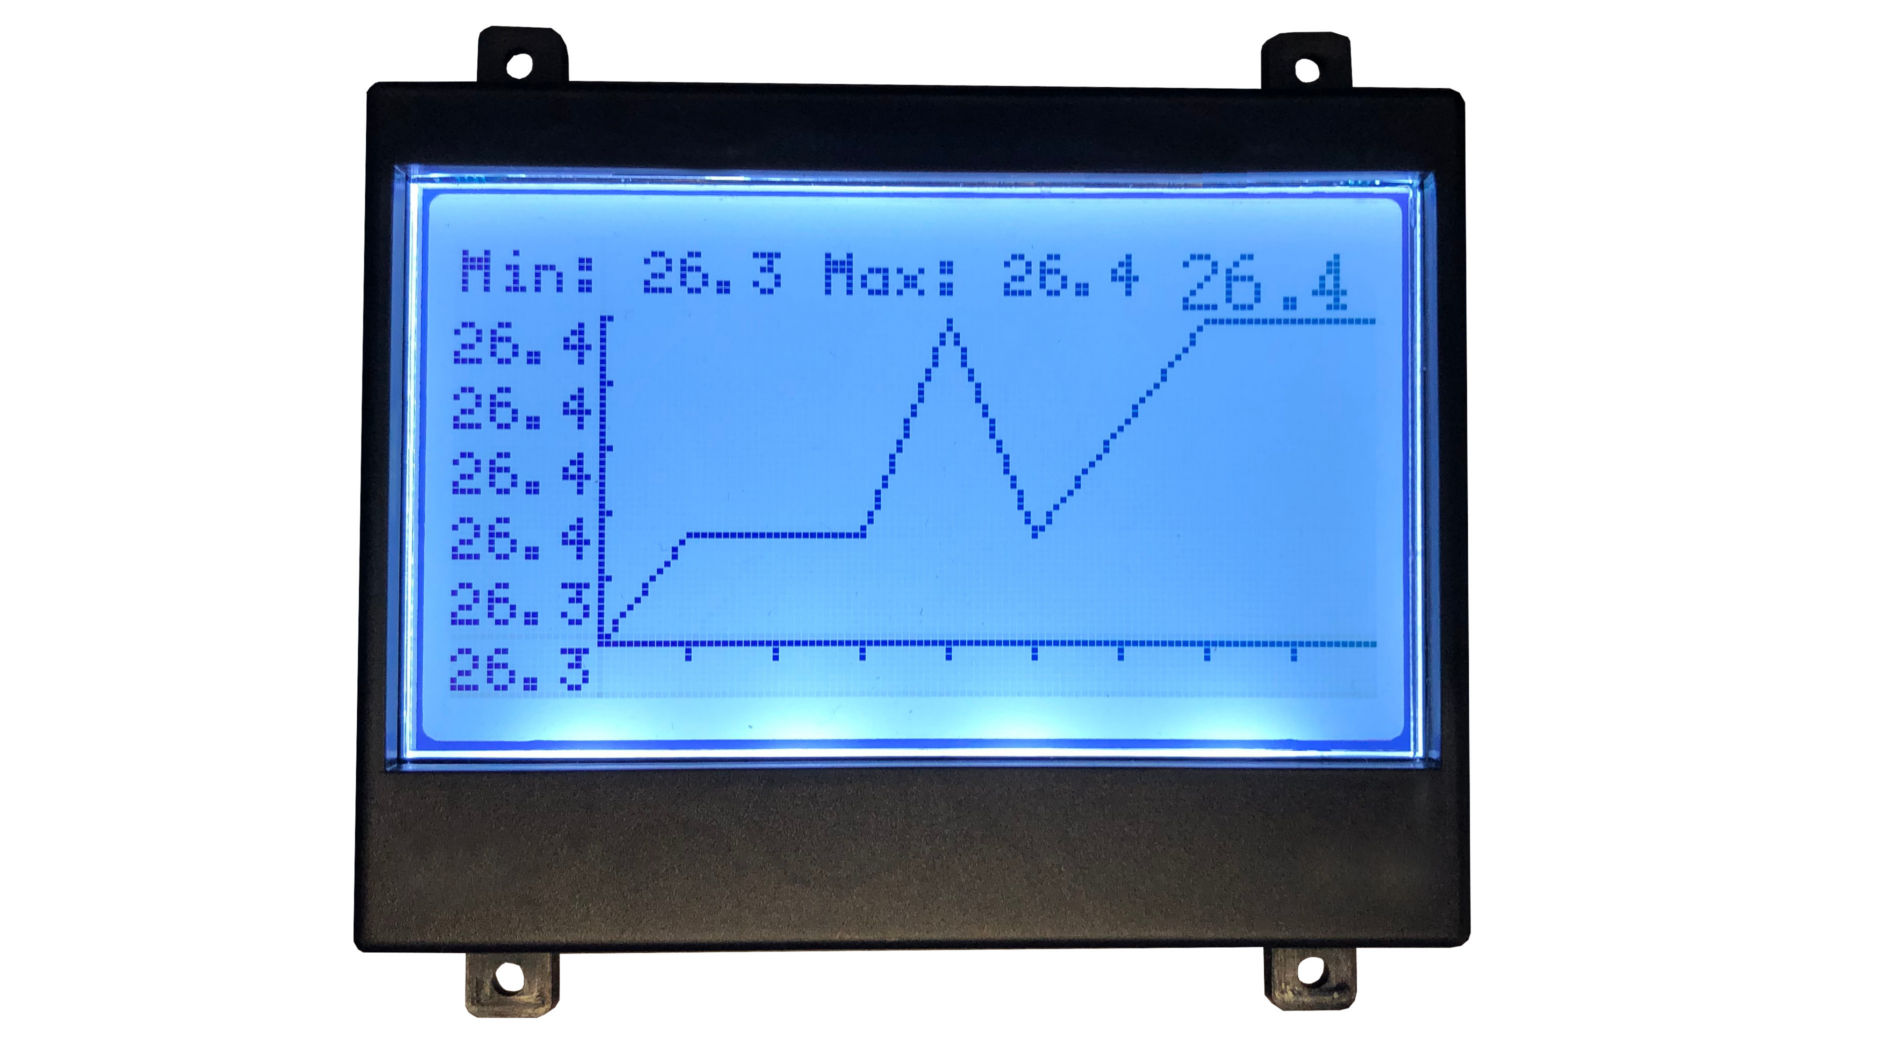
Run your Plotting.java file. You will see a graph being displayed on the Graphic LCD.
Run Your Program
Run your program. You will see a graph being displayed on the Graphic LCD.
Run Your Program
Run your plotting.py script. You will see a graph being displayed on the Graphic LCD.
Practice
- Try graphing values from a different sensor.
- Try modifying the LCDPlot file to add new functionality to the graphing library.