Setup
All you need for this project is the Getting Started Kit.
Install Matplotlib
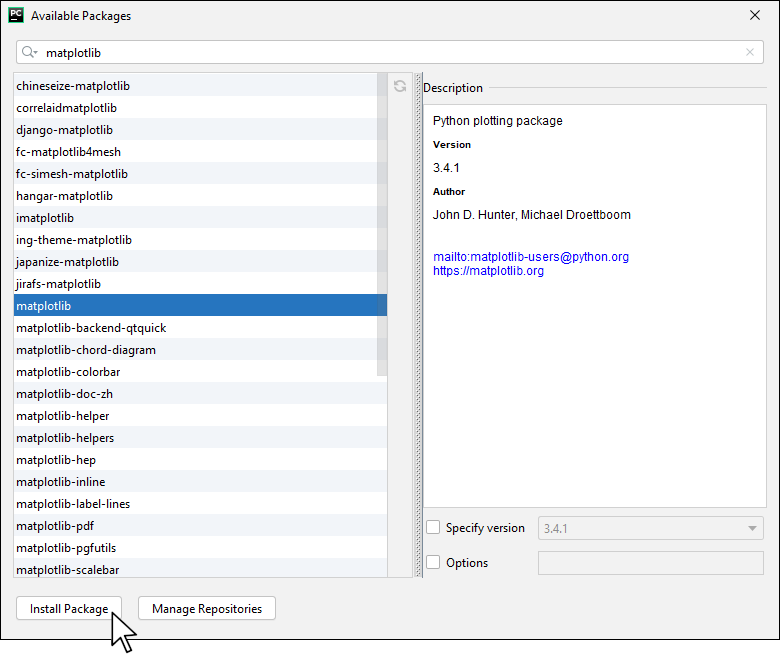
In order to use Matplotlib, you first have to install it. You do this in the same way you previously installed the Phidget22 library. Simply navigate to your package manager, search for matplotlib and press install!
Thonny
If you're using Thonny, select Tools > Manage Packages and search for matplotlib.

PyCharm
If you're using PyCharm, select File > Settings > Python Interpreter and use the + symbol to install matplotlib.
PyScripter
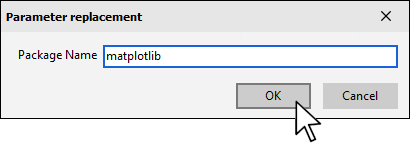
If you're using PyScripter, select Tools > Tools > Install Packages with pip and enter matplotlib.
Write Code
Copy the code below into a new Python project. If you need a reminder of how to do this, revisit the Getting Started Course.
#imports for matplotlib
import matplotlib.pyplot as plt
from matplotlib.animation import FuncAnimation

#Add Phidgets Library
from Phidget22.Phidget import *
from Phidget22.Devices.TemperatureSensor import *

fig, ax = plt.subplots()
size = 100 #modify this for more or less points on graph
xdata = range(0, size) #x-axis values
ydata = [0] * size #y-axis values
ln, = plt.plot(xdata, ydata, 'ro-')

#Create, open, set data interval
temperature = TemperatureSensor()
temperature.setChannel(0)
temperature.openWaitForAttachment(1000)
temperature.setDataInterval(temperature.getMinDataInterval())

def init():
    ax.set(xlabel='samples', ylabel='temperature (°C)',
       title='Getting Started Kit')
    ax.set_xlim(0, size)
    ax.set_ylim(10, 30) #expected range of temperature
    return ln,

def update(i, ydata):
    ydata.append(temperature.getTemperature())
    ydata = ydata[-size:]
    ln.set_ydata(ydata)
    return ln,

ani = FuncAnimation(fig,
                    update,
                    fargs=(ydata,),
                    init_func=init,
                    interval=temperature.getDataInterval(),
                    blit=True)
plt.show()
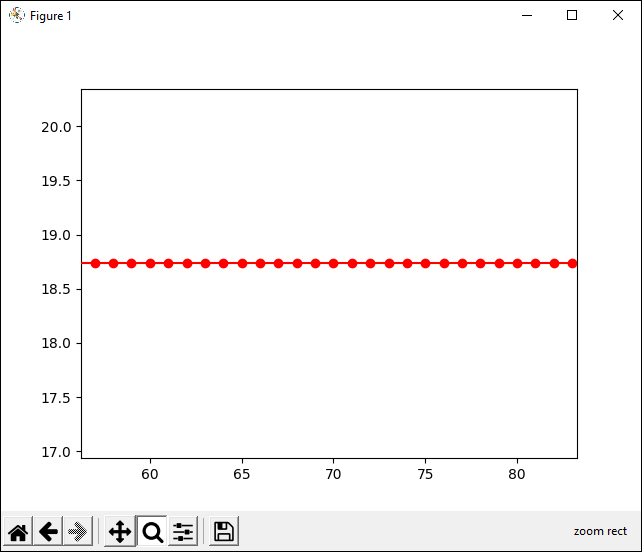
Run your program. You will see a graph appear and it will start plotting points.
Practice
- Try modifying the size variable, what does it do?
- Modify the program to graph data from a different Phidget sensor like distance, or light.