Reading an I2C Color Sensor
Introduction
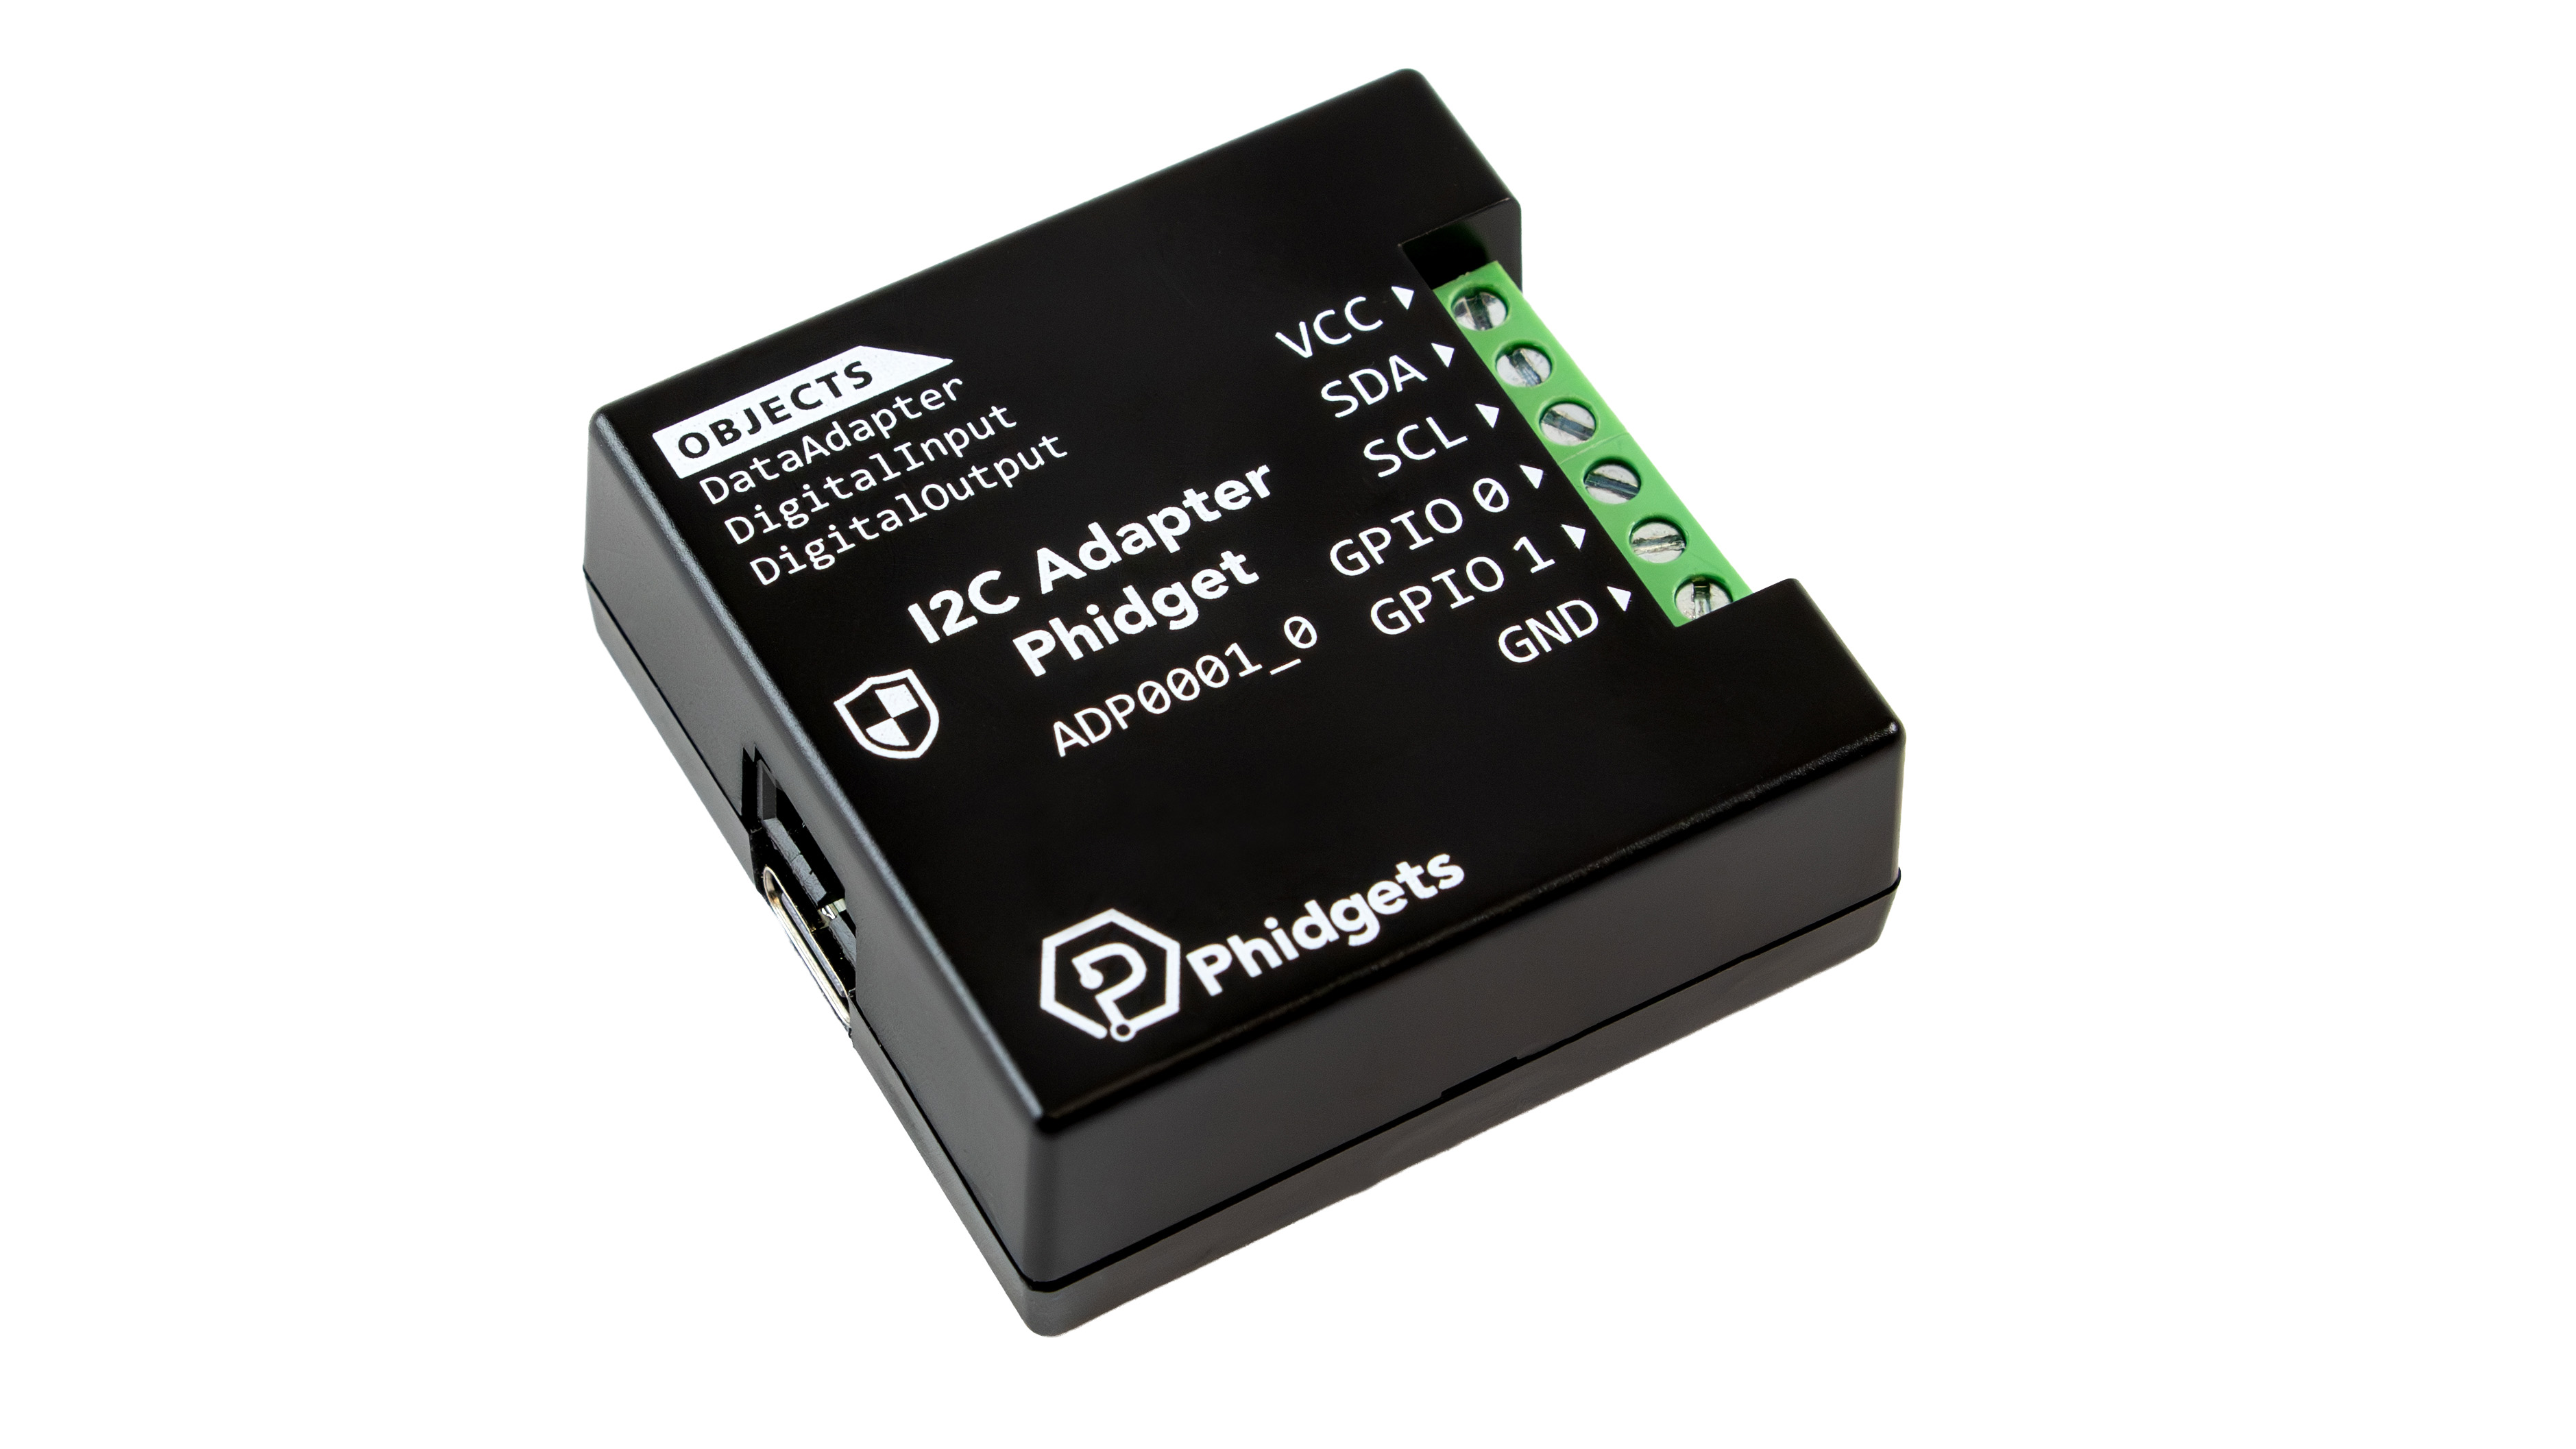
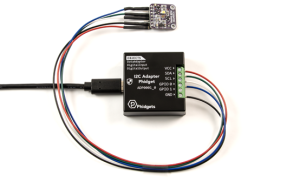
The I2C Adapter Phidget allows you to interface with a wide range of I2C-compatible devices, including sensors, displays, and more.
In this project, we will use it to read data from an RGB Color Sensor.
Steps
To complete this project, we will work through the following steps:
- Determine the device's basic configuration parameters
- Identify the sequence of commands expected by the device
- Connect the device to the I2C Adapter Phidget
- Test the device using the Phidget Control Panel
- Create a custom program.
Resources
Information from the following resource will be referenced throughout this project.
Demonstration
Configuration Parameters
During this step, we are looking for the following information:
- Supply Voltage
- Communication Frequency
- Device Address
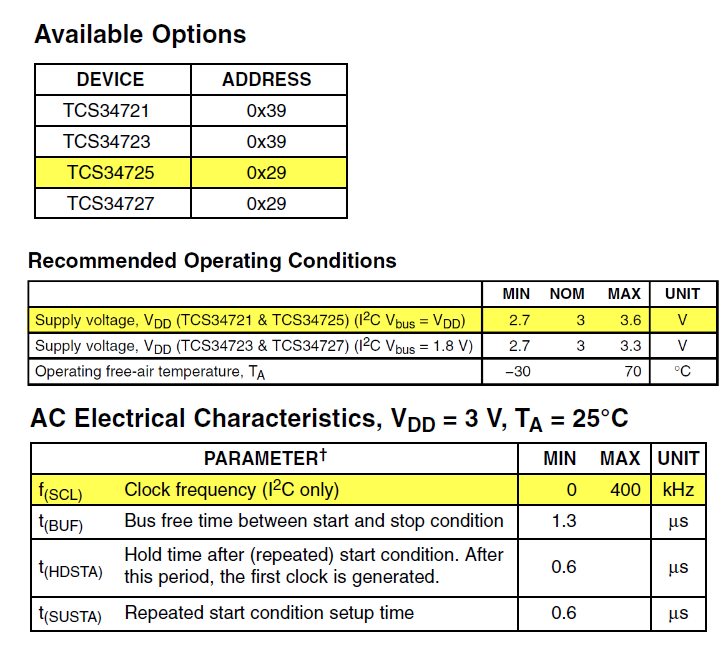
This information is typically found using the device's product page and/or datasheet. In this case, it was all found on pages 3 to 5 of the datasheet:
- Supply Voltage: 3.3V
- Communication Frequency: 400kHz
- I2C Address: 0x29
Command Sequence
Next, we need to determine the sequence of commands the device is expecting. The TCS34725 datasheet provides a state diagram that we can use to create a list of actions:
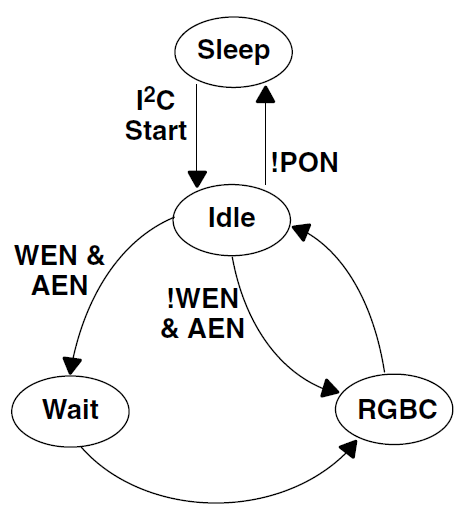
Based on the state diagram, our list of actions should look like this:
Power On Steps:
- Enable PON (power on) to go from sleep to idle state
- Enable AEN (RGB enabled) to go from idle to RGBC state
After these steps, the device should be able to provide data and respond to commands. We're not using WEN (wait enabled) since we don't need this power-saving feature at this time.
Writing to TCS34725 Registers
I2C devices typically expect the following format:
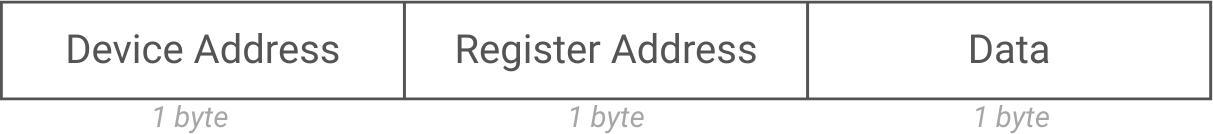
This protocol diagram from page 12 of the datasheet confirms that the TCS34725 behaves as expected:
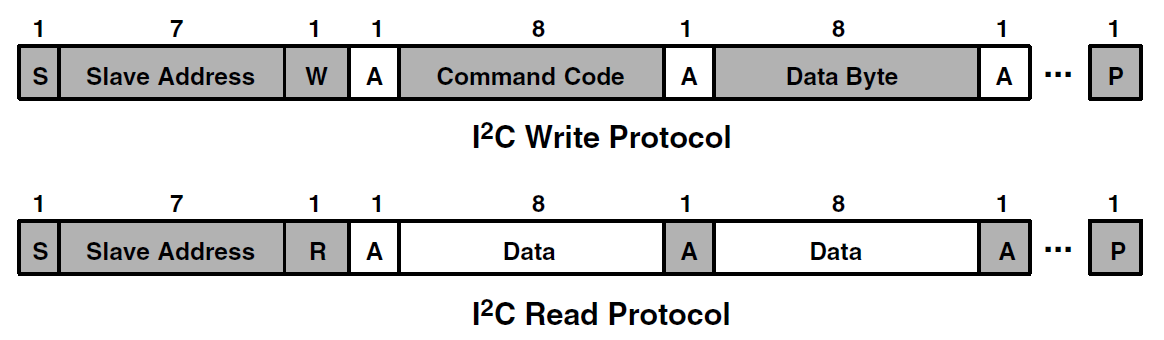
The Start (S), Stop (P), Acknowledge (A), and W/R (Write/Read) is all handled internally by the I2C Phidget, so we just need to focus on the command code and data.
Command Register
The command register lets us tell the sensor which register we want to read or write on our next communication.
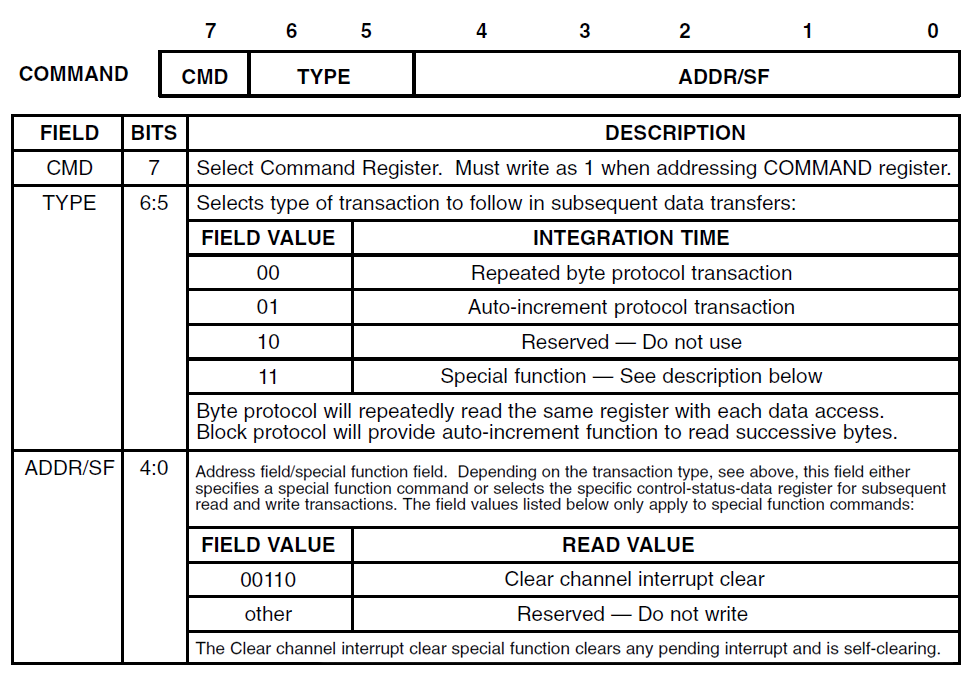
- The first bit is always '1'
- The next two bits control the how the device behaves when requesting multiple bytes
- The last five bits hold the register address (we can ignore the special functions for this project)
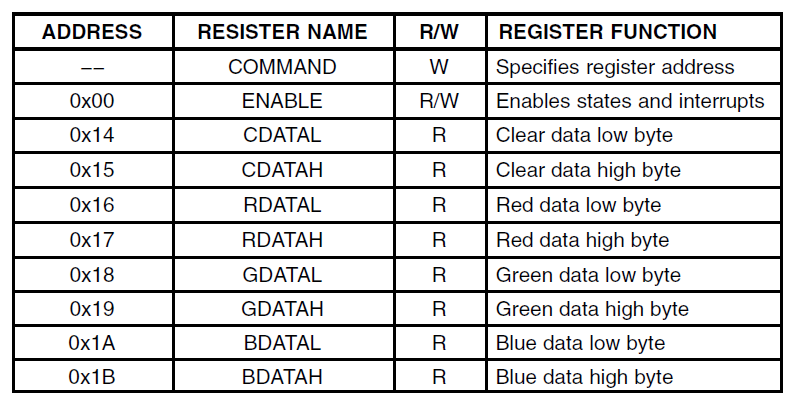
Here's an abridged list of registers we'll be using:
Power On Steps
Enable the Sensor
Enable is managed by register 0x00, so our command register will look like this:
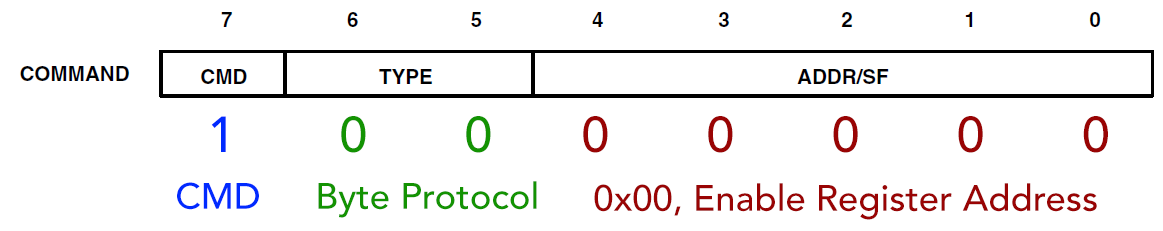
So we'll send 0x80 to select the enable register.
The enable register is defined in the datasheet as follows:
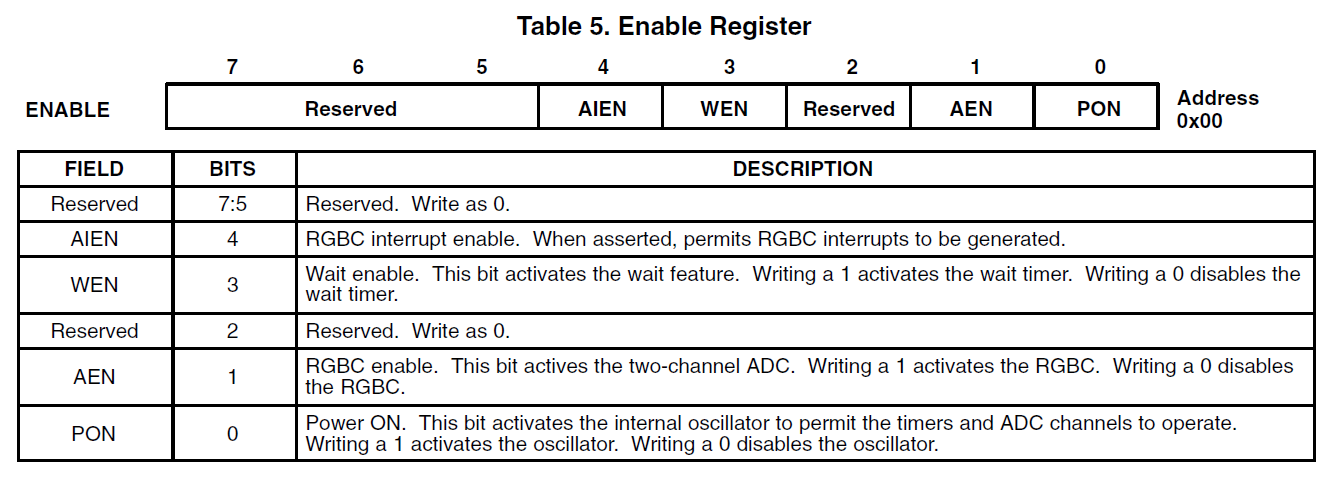
- Bits 5, 6, and 7 are 000, as they're reserved
- Bit 4 will be 0, since we're not using interrupts
- Bit 3 will be 0, since we're not using the wait feature
- Bit 2 is 0, as it's reserved
- Bit 1 will be 0, since we're not enabling RGBC yet
- Bit 0 will be 1, to enable power
That gives us 0x01. Together with our command register, our first communication will be 0x8001. The reason we don't enable RGBC yet is because the device requires a 2.4ms delay between PON and RGBC for reliable startup.
Enable RGBC
To enable RGBC we will use the same command we used for power on, but both the AEN bit and the PON bit will be 1. This gives us 0x8003.
Reading Data
Now that the sensor is initialized, we can start getting data from it. We want to read all eight color registers, so we need to set auto-increment in the command register and point it to the first color register which is at 0x14:
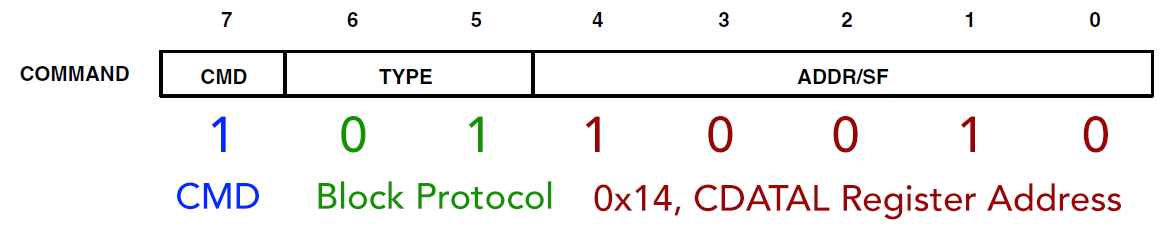
This means we need to send B4. After that, we can listen for 8 bytes at a time to get all of our color data.
Connecting to the ADP0001
The pinout for this sensor is printed on the PCB:
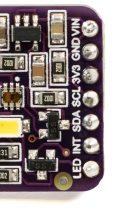
- VIN - Power
- GND - Ground
- 3V3 - 3.3V Output
- SCL - Serial Clock
- SDA - Serial Data
- INT - Interrupt
- LED - LED toggle
We don't need the 3.3V output or the interrupt pin for this project. The other pins can be connected to the ADP0001 as follows:
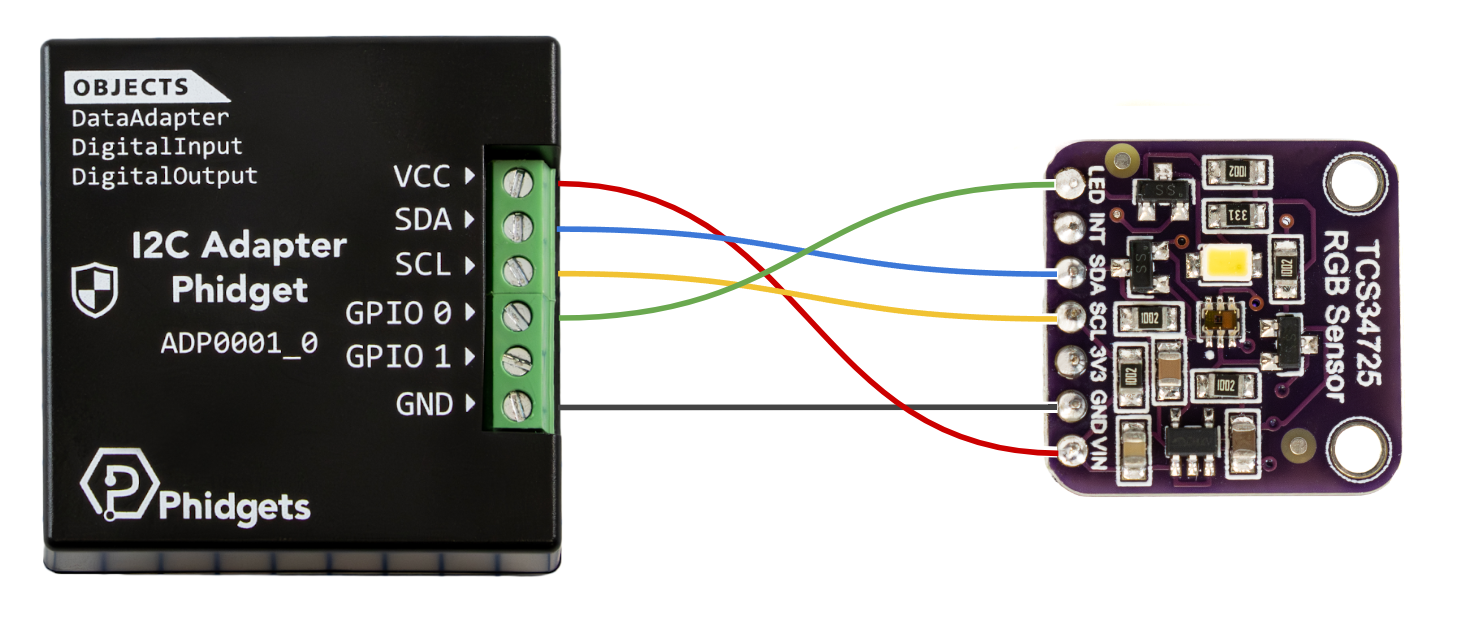
The LED toggle pin is connected to one of the ADP0001's GPIO pins so we can use it to turn off the LED when not in use.
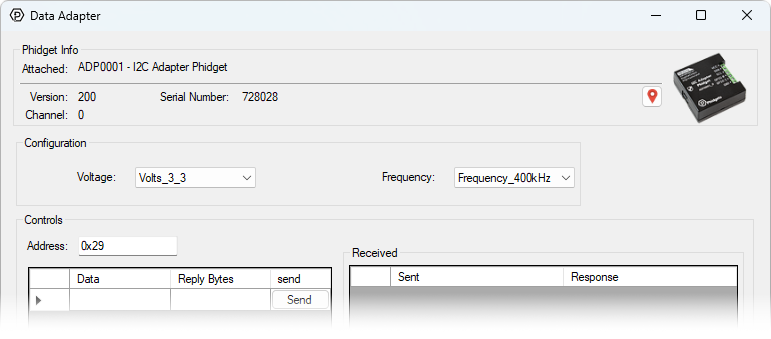
Testing in the Phidget Control Panel
Now that we have the command sequence and our sensor connected, we can use the Phidget Control Panel to confirm our device is working as expected.
Power On Steps
We can set the voltage to 3.3V, the frequency to 400kHz, and the address to 0x29.
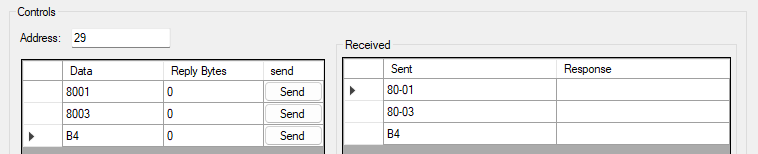
Now we can enable the sensor with our command sequence:
- 0x8001 (Power on)
- 0x8003 (RGBC on)
- 0xB4 (auto increment and start from register 0x14)
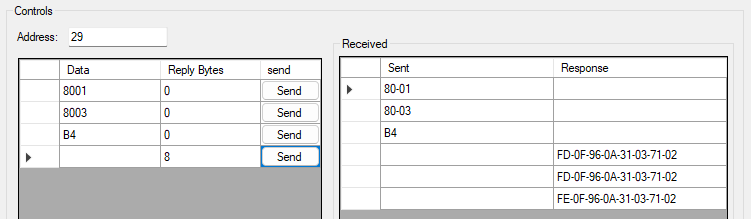
Reading Data
After sending the command register B4, we can read all color registers by reading 8 bytes at a time.

This sensor ultimately provides us with four 16-bit values: Clear, Red, Green, and Blue. The clear light value is important for providing brightness calibration. Since the responses of the red, green and blue sensors are normalized to match the response of the clear sensor, we can use it as a baseline to determine color in both bright and dim environments.
In the above image, we get roughly the same value when polling the sensor three times, so the value seems stable. We'll use the bottom row to see if the color makes sense. The data bytes received are sent in register order, so our values are:
- Clear: 0x0FFD
- Red: 0x0A96
- Green: 0x0331
- Blue: 0x0271
Converting to decimal, that's 4093, 2710, 817, 625. We can normalize the last three values using the clear value, and then multiply by 255 and round to get a standard RGB value:
- Red: (2710/4093)*255 = 169
- Green: (817/4093)*255 = 51
- Blue: (625/4093)*255 = 39
This RGB value (#A93327) looks to be correct, as the sensor was pointed at a roll of red electrical tape.
Writing a Custom Program
To begin writing a custom program for your Phidget device, navigate to the product page and select the Code Samples tab. From there, you can customize the code for your own purposes. Here we have modified the Python code sample to match our steps from the Phidget Control Panel.
from Phidget22.Phidget import *
from Phidget22.Devices.DataAdapter import *
import time

def convert_rgbc(data):

	c = data[1] << 8 | data[0]

	if(c <= 0):
		return [0,0,0]

	# Combine high and low bytes for each color,
	# Then normalize and cap at 255
	r = min(255,round((data[3] << 8 | data[2]) / c * 255))
	g = min(255,round((data[5] << 8 | data[4]) / c * 255))
	b = min(255,round((data[7] << 8 | data[6]) / c * 255))
	return [r,g,b]

def main():

	adp = DataAdapter()
	adp.openWaitForAttachment(5000)

	# Set properties
	adp.setFrequency(DataAdapterFrequency.FREQUENCY_400kHz)
	adp.setDataAdapterVoltage(DataAdapterVoltage.DATAADAPTER_VOLTAGE_3_3V)
	addr = 0x29

	# Power On
	adp.i2cSendReceive(addr, [0x80, 0x01], 0)
	time.sleep(0.01)

	# RGBC On
	adp.i2cSendReceive(addr, [0x80, 0x03], 0)

	# Auto-increment starting with CDATAL
	adp.i2cSendReceive(addr, [0xB4], 0)

	try:
		while True:
			rgb = convert_rgbc(adp.i2cSendReceive(addr, [], 8))
			print("R: " + str(rgb[0]) + "   G: " + str(rgb[1]) + "   B: " + str(rgb[2]))
			time.sleep(0.5)
			pass
	except KeyboardInterrupt:
		print("Closing...")

	adp.close()

main()
That’s about it, we went from reading the datasheet to a working script. Not all datasheets are created equal, so if you’re struggling with getting your sensor set up, feel free to ask for help by sending us an email.
Python Graphical Example
Here is a more in-depth script that displays a graph of the raw values and shows the calculated color after gamma and saturation adjustment.
import tkinter as tk
import math
from Phidget22.Phidget import *
from Phidget22.Devices.DataAdapter import *
import time

class MultiLineGraph(tk.Canvas):
    def __init__(self, parent, lines=4, max_points=100, **kwargs):
        super().__init__(parent, bg="black", **kwargs)
        self.lines = lines
        self.max_points = max_points
        self.data = [[] for _ in range(lines)]
        self.colors = ["white", "red", "green", "blue"]

    def add_points(self, *values):
        for i, v in enumerate(values):
            self.data[i].append(v)
            if len(self.data[i]) > self.max_points:
                self.data[i].pop(0)
        self.draw()

    def draw(self):
        self.delete("all")
        w = self.winfo_width()
        h = self.winfo_height()

        if w < 10 or h < 10:
            return

        # Flatten all visible data
        all_values = [v for line in self.data for v in line]

        if not all_values:
            return

        min_val = min(all_values)
        max_val = max(all_values)

        # Prevent divide-by-zero
        if max_val == min_val:
            max_val += 1

        padding = (max_val - min_val) * 0.1  # 10% padding
        min_val -= padding
        max_val += padding

        for i, line in enumerate(self.data):
            if len(line) < 2:
                continue

            points = []
            for j, val in enumerate(line):
                x = j / (self.max_points - 1) * w

                # Normalize to 0–1
                norm = (val - min_val) / (max_val - min_val)

                # Flip Y (Tkinter origin is top-left)
                y = h - (norm * h)

                points.extend([x, y])

            self.create_line(points, fill=self.colors[i], width=2)


class App:
    def __init__(self, root):
        self.root = root
        self.root.title("I2C RGB Viewer")
        self.adp = DataAdapter()
        self.addr = 0x29
        self.sat = 1.8
        self.gamma = 1.3

        # --- Define Gamma Table ---
        self.gamma_table = [0] * 256
        for i in range(256):
            self.gamma_table[i] = int(math.pow(i/255.0,self.gamma)*255)

        # --- UI ---
        self.graph = MultiLineGraph(root, height=300)
        self.graph.pack(fill="both", expand=True)

        self.rgb_entry = tk.Entry(root, font=("Consolas", 14))
        self.rgb_entry.pack(fill="x")

        self.color_panel = tk.Frame(root, height=50, bg="black")
        self.color_panel.pack(fill="x")

        self.adp.openWaitForAttachment(5000)

        # Set properties
        self.adp.setFrequency(DataAdapterFrequency.FREQUENCY_400kHz)
        self.adp.setDataAdapterVoltage(DataAdapterVoltage.DATAADAPTER_VOLTAGE_3_3V)

        # Power On
        self.adp.i2cSendReceive(self.addr, [0x80, 0x01], 0)
        time.sleep(0.01)

        # RGBC On
        self.adp.i2cSendReceive(self.addr, [0x80, 0x03], 0)

        # Auto-increment starting with CDATAL
        self.adp.i2cSendReceive(self.addr, [0xB4], 0)

        # --- Timer ---
        self.update_loop()

    def read_sensor(self):

        data = self.adp.i2cSendReceive(self.addr, [], 8)

        # Combine high and low bytes for clear register
        raw_c = data[1] << 8 | data[0]

        if(raw_c <= 0):
            return [0,0,0,0]

        # Combine high and low bytes for each colour
        raw_r = data[3] << 8 | data[2]
        raw_g = data[5] << 8 | data[4]
        raw_b = data[7] << 8 | data[6]

        return raw_c, raw_r, raw_g, raw_b

    def update_loop(self):
        raw_c, raw_r, raw_g, raw_b = self.read_sensor()

        if raw_c > 0:
            # Normalize + gamma
            norm_r = self.gamma_table[int(raw_r / raw_c * 255)]
            norm_g = self.gamma_table[int(raw_g / raw_c * 255)]
            norm_b = self.gamma_table[int(raw_b / raw_c * 255)]

            avg = (norm_r + norm_g + norm_b) / 3

            # Saturation adjust
            norm_r = max(0, min(255, avg + (norm_r - avg) * self.sat))
            norm_g = max(0, min(255, avg + (norm_g - avg) * self.sat))
            norm_b = max(0, min(255, avg + (norm_b - avg) * self.sat))

            hex_color = "#{:02X}{:02X}{:02X}".format(
                int(norm_r), int(norm_g), int(norm_b)
            )

            self.rgb_entry.delete(0, tk.END)
            self.rgb_entry.insert(0, hex_color)

            self.color_panel.config(bg=hex_color)

        # Update graph
        self.graph.add_points(raw_c, raw_r, raw_g, raw_b)

        # Repeat every 50 ms
        self.root.after(50, self.update_loop)


if __name__ == "__main__":
    root = tk.Tk()
    app = App(root)
    root.geometry("600x400")
    root.mainloop()