|
Notice: This page contains information for the legacy Phidget21 Library. Phidget21 is out of support. Bugfixes may be considered on a case by case basis. Phidget21 does not support VINT Phidgets, or new USB Phidgets released after 2020. We maintain a selection of legacy devices for sale that are supported in Phidget21. We recommend that new projects be developed against the Phidget22 Library.
|
Data Logging With a Thermocouple: Difference between revisions
No edit summary |
|||
| Line 99: | Line 99: | ||
===C# Code and Discussion=== | ===C# Code and Discussion=== | ||
The data logger | The data logger C# source code we used can be downloaded here: [[File:App_guide_templogger_csharpcode.cs]] | ||
The entire source code (as this Guide is about data logging code) is: | The entire source code (as this Guide is about data logging code) is: | ||
Latest revision as of 18:09, 28 August 2012
The project described here is a data recording program for the Phidget Temperature Sensors. We play with the program and record data to learn things about our environment.
Although we use the Temperature Sensors, the emphasis in this Guide is on data logging - passing data and writing to files in different languages, and also dealing with data in general.
Practical concepts covered are (click on links to see other projects on that topic):
|
|
As with any of our described projects, Phidgets takes care of the electrical component design. Here, we also provide some simple code so you can play around with your Temperature Sensor and thermocouple, and save the data to plot later.
| Time: | About two hours for the basics, three hours for looking at and analysing the data |
| Special Needed Tools: | Something hot (tea, your skin), or something cold (ice, etc) |
| Materials and Phidgets: | A Phidget Temperature Sensor (1048 or 1051), a Thermocouple, a USB cord, and your computer |
Also:
- You should have already worked through our Getting Started Guide for your Temperature Sensor, found in its user guide - this will show you how to get the the Phidget Libraries installed for your operating system.
- Your computer should have at least one of:
- A version of Python 2.6 or later, set up with the Python Phidget Libraries
- A version of Java, set up with the Java Phidget Libraries
- If you are using Linux (or the Phidget SBC), you can also use the gcc C compiler
- Set up the Phidget C libraries on Linux
- Set up gcc for development on the Phidget SBC
- If you would like to follow along with the graphing examples, you can install the R Statistical package, which is free and available for Windows, Mac, and Linux.
Introduction
This application guide is all about basic data logging and analysis with Phidgets. The ability to write an automatic data logger is one of the strong advantages to Phidgets - you do not have to take visual readings of a thermometer (or other sensor) and record the readings in a log book manually. Rather, you can simply log directly to a computer.
Thermocouples provide a way to inexpensively measure the temperature of a material through physical contact. Although we use thermocouples and a Phidget Temperature Sensor (1048 or 1051) as our Phidget to log data from, basic data logging will be similar for many other Phidgets.
Phidgets
To use the code in this Guide, you will need to have a Phidget Temperature sensor and a thermocouple.
Some example ways to set this up are:
| Example Setup | Strengths |
|---|---|
| Basic thermocouple setup | |
| Ability to measure multiple points | |
| Wide temperature range thermocouple |
Of course, these are only examples - any thermocouple with either Temperature Sensor Phidget board will work.
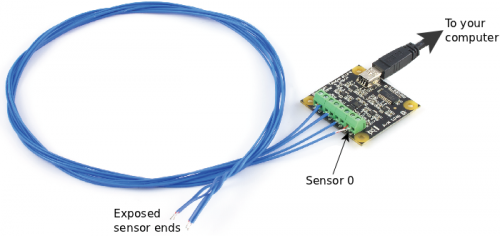
We will log data from thermocouple port 0. On a one-input board, this is the only thermocouple input; on a four-input board, make sure you have a thermocouple plugged in to sensor port 0:

Then:
- Make sure you have followed the Getting Started guide for your Temperature Sensor, found in its user guide
- Make sure you have the programming language libraries that you want installed
- Plug the USB cord on the Temperature Sensor in to your computer
- Continue on to the next section and start writing code!
Code
For all platforms, we wrote code in Java, C#, and Python.
The C/C++ language has no method of accurate time stamping in a platform-independent way. The C/C++ code here was written for a POSIX (Linux and Phidget Single Board Computer) system, but can be easily adapted for Windows.
C# Code and Discussion
The data logger C# source code we used can be downloaded here: File:App guide templogger csharpcode.cs
The entire source code (as this Guide is about data logging code) is:
using System;
using System.IO;
using System.Diagnostics;
using System.Text;

using Phidgets;
using Phidgets.Events;

namespace DataLogger {
    class Code {

        // Obtain an initial time from which to generate timestamps
        public static Stopwatch stopwatch = Stopwatch.StartNew();

        // Clear and open the file for writing
        public static FileStream outFile = new FileStream(@"temperature_data_csharp.csv", FileMode.Create);

        static void Main(string[] args) {
            try {

                // Print a text header to the file first thing
                string header = "Time,Thermocouple-Temperature,Ambient-Board-Temperature\n";
                System.Text.ASCIIEncoding encoding = new System.Text.ASCIIEncoding();
                Byte[] bytes = encoding.GetBytes(header);
                outFile.Write(bytes, 0, bytes.Length);
                outFile.Flush();

                // Create the Phidget software object, hook in the event function, and open the object
                TemperatureSensor device = new TemperatureSensor();
                device.TemperatureChange += new TemperatureChangeEventHandler(temperatureDataHandler);
                device.open();
                device.waitForAttachment();

                // Set the thermocouple type and trigger on port [0] (0 = record all data)
                device.thermocouples[0].Sensitivity = 0;
                device.thermocouples[0].Type =
                    TemperatureSensorSensor.ThermocoupleType.PHIDGET_TEMPERATURE_SENSOR_K_TYPE;

                Console.WriteLine("Press Enter to end anytime...");
                Console.Read();

                device.close();
                device = null;
            }
            catch (PhidgetException ex) { Console.WriteLine(ex.Description); }

        }

        // Create a listener function to handle all temperature data events
        static void temperatureDataHandler(object sender, TemperatureChangeEventArgs e) {
            double microseconds = stopwatch.ElapsedMilliseconds / 1000.0;

            // Start composing a string of data from this event
            string data = microseconds + "," + e.Temperature + ",";

            // Get the board temperature and add it to the string
            data = data + ((TemperatureSensor)sender).ambientSensor.Temperature + "\n";

            // The raw write method involves translating our string into bytes, like Java
            System.Text.ASCIIEncoding  encoding = new System.Text.ASCIIEncoding();
            Byte[] bytes = encoding.GetBytes(data);
            outFile.Write(bytes, 0, bytes.Length);

            // Print a dot to the console to indicate another more data written
            Console.Write(".");
            Console.Out.Flush();
        }
    }
}
Some highlights:
- Line 13 and 51: To create timestamps for the data being recorded, we use
System.Diagnostics.StopWatchto accurately obtain the elapsed time. - Lines 16, 22-26 and 60-62: To start with a fresh, empty file each time, we use a
FileStreamwhich writes raw bytes and starts at offset 0. - Line 36-37: We used a K-type thermocouple. You need to change this line to your thermocouple type.
- Line 35: We set the sensitivity (trigger) to 0, to record all data. Setting a value above 0 will only record changes greater than or equal to that value.
Compile and Run
C# requires, due to the class name, that this code be saved in a file called Code.cs, or you can change the class name to whatever file name you would like. If you need help compiling and running Phidgets C# code and linking Phidget21.NET.dll, you should try the in-depth instructions on the Language - C Sharp page.
Note: If you are using Visual Studio (by copy and pasting the code into a project), the output file temperature_data_csharp.csv will be written to the bin → Debug folder within your project.
Java Code and Discussion
The data logger Java source code we used can be downloaded here: File:App guide templogger javacode.java
The entire source code (as this Guide is about data logging code) is:
import com.phidgets.*;
import com.phidgets.event.*;
import java.io.*;

public class DataLogger {

    public static final void main(String args[]) throws Exception {

        // Clear and open the csv file for writing, and write the header
        final FileOutputStream outFile = new FileOutputStream("temperature_data_java.csv");
        String header = "Time,Thermocouple-Temperature,Ambient-Board-Temperature\n";
        outFile.write(header.getBytes(), 0, header.length());
        outFile.flush();

        // Get a start time from which we can generate timestamps later
        final long start = System.nanoTime();

        // Create the Phidget software object
        TemperatureSensorPhidget device;
        device = new TemperatureSensorPhidget();

        // Attach a listener function to changes in thermocouple temperature
        TemperatureChangeListener temperatureDataHandler;
        device.addTemperatureChangeListener(new TemperatureChangeListener() {
            public void temperatureChanged(TemperatureChangeEvent event) {

                long now = System.nanoTime();
                // The nanoTime() function gives us microseconds; we want seconds.
                double timeDifference = (now - start) / 1000000000.0;
                // Initialize the board temperature with some impossible number
                double ambientTemperature = -99;

                // Cast the event into a specific (TemperatureSensor) Phidget
                // This must be done separately from calling a device function
                TemperatureSensorPhidget localDevice = (TemperatureSensorPhidget)event.getSource();

                // Get the board temperature
                try {
                    ambientTemperature = localDevice.getAmbientTemperature();
                } catch (PhidgetException exception) {
                    System.out.println(exception);
                }

                // Print dots to indiciate one more point recorded
                System.out.print(".");
                System.out.flush();

                // Write the data to the text file
                String output = timeDifference + "," + event.getValue() + "," + ambientTemperature + "\n";
                try {
                    outFile.write(output.getBytes(), 0, output.length());
                    outFile.flush();
                } catch (IOException exception) {
                    System.out.println(exception);
                }

            }
        });

        // Open the device and make sure it is plugged in
        device.openAny();
        device.waitForAttachment(10000);

        // Set the thermocouple type and trigger (0 = record all data)
        try {
            device.setThermocoupleType(0, device.PHIDGET_TEMPERATURE_SENSOR_K_TYPE);
            device.setTemperatureChangeTrigger(0, 0);
        } catch (PhidgetException exception) {
            System.out.println(exception);
        }

        System.out.println("Press Enter to end anytime...\n");
        System.in.read();

        outFile.close();

        device.close();
        device = null;
    }
}
Some highlights:
- Line 16 and 27: To create timestamps for the data being recorded, we use
System.nanoTime()to accurately obtain the elapsed time. - Lines 10-12 and 49-52: To start with a fresh, empty file each time, we use a
FileOutputStreamwhich writes raw bytes and starts at offset 0. - Line 66: We used a K-type thermocouple. You need to change this line to your thermocouple type.
- Line 67: We set the sensitivity (trigger) to 0, to record all data. Setting a value above 0 will only record changes greater than or equal to that value.
Compile and Run
Java requires, due to the class name, that this code be saved in a file called DataLogger.java. If you need help compiling and running Phidgets java code and linking phidget21.jar, you should try the in-depth instructions on the Language - Java page.
Python Code and Discussion
The data logger Python source code we used can be downloaded here: File:App guide templogger pythoncode.py
The entire source code (as this Guide is about data logging code) is:
#! /usr/bin/python

from time import time
import sys

from Phidgets.PhidgetException import PhidgetErrorCodes, PhidgetException
from Phidgets.Events.Events import *
from Phidgets.Devices.TemperatureSensor import *

# Define an error catching function so we can call it on "try...except" blocks
def LocalErrorCatcher(event):
    print("Phidget Exception: " + str(e.code) + " - " + str(e.details) + ", Exiting...")
    exit(1)

# Obtain an initial time from which to generate timestamps
start = time()

# Clear and open the data file for writing
outfile = open("temperature_data_py.csv", "w")

# Create a listener function for changes in thermocouple temperature
def TemperatureDataHandler(e):
    global start
    global outfile

    now = time() - start

    # Get the board temperature
    ambientTemp = e.device.getAmbientTemperature()

    # Write the data to the text file
    outfile.write(str(now) + "," + str(e.temperature) + "," + str(ambientTemp) + "\n")

    # Print a dot to indicate one more point recorded
    sys.stdout.write(".")
    sys.stdout.flush()

# Write a header to the text file first thing
outfile.write("Time,Thermocouple-Temperature,Ambient-Board-Temperature\n")

# Create the Phidget software object, hook in the event function, and open the object
device = TemperatureSensor()
device.setOnTemperatureChangeHandler(TemperatureDataHandler)
device.openPhidget()
device.waitForAttach(10000)

# Set the thermocouple type and trigger (0 = record all data)
try:
    device.setThermocoupleType(0, ThermocoupleType.PHIDGET_TEMPERATURE_SENSOR_K_TYPE)
except PhidgetException as e: LocalErrorCatcher(e)
device.setTemperatureChangeTrigger(0, 0)

print("Press Enter to end anytime...");
character = str(raw_input())

device.closePhidget()
exit(0)
Some highlights:
- Line 16 and 26: To create timestamps for the data being recorded, we use
time()to accurately obtain the elapsed time. - Lines 19: We start with a fresh, empty file with the same name each time, overwriting previous contents.
- Line 49: We used a K-type thermocouple. You need to change this line to your thermocouple type.
- Line 51: We set the sensitivity (trigger) to 0, to record all data. Setting a value above 0 will only record changes greater than or equal to that value.
Compile and Run
To run the Python code on your system, you can save it in a file such as code.py and then run it from a command line or terminal with:
python code.py
If this basic reminder doesn't help you run the code, you probably will want the in-depth instructions on the Language - Python page.
C Code and Discussion
If you are using Windows, please refer to the Java or Python section as the C code was written on Linux, including the Phidget Single Board Computer (SBC). The use of Phidgets in C on any operating system is the same. However, ANSI-based C does not include support for getting time on any resolution smaller than one second. So, to obtain timing for the data as it comes in, we need to use operating-system specific code. It would be fairly straightforward to modify this code to use a Windows method of obtaining time.
The data logger Linux C source code we used can be downloaded here: File:App guide templogger ccode.c
The entire source code (as this Guide is about data logging code) is:
// Linux version

#include <stdio.h>
#include <stdlib.h>

#include <time.h>
#include <sys/time.h>

#include <phidget21.h>

// This struct gets passed through the "usrptr" part of the Phidgets API
struct userStruct {
   struct timespec start;
   FILE *outputFile;
};

// Create a listener function for changes in thermocouple temperature
int TemperatureDataHandler(CPhidgetTemperatureSensorHandle device,
                           void *userptr, int index, double data)
{
    double ambientTemperature;

    struct timespec now;
    double timeDifference;
    clock_gettime(CLOCK_REALTIME, &now);

    // Extract the passed user data structure, and the file pointer within it
    struct userStruct *passedData = (struct userStruct *) userptr;
    FILE *file = passedData->outputFile;

    // Get the board temperature
	CPhidgetTemperatureSensor_getAmbientTemperature(device, &ambientTemperature);

    // Print dot to the screen to indicate one more data point recorded
    printf(".");
    fflush(stdout);

    // Sums the seconds plus nanoseconds
    // Translates to seconds by using 10^9 nanoseconds per second
    timeDifference = ((now.tv_sec - passedData->start.tv_sec) +
        (float) (now.tv_nsec - passedData->start.tv_nsec) / 1000000000.0);

    fprintf(file, "%6f, %6f, %6f\n", timeDifference, data, ambientTemperature);
    fflush(file);

    return 0;
}

int main(int argc, char* argv[]) {

    int result;
    char character;

    // Obtain an intial time from which to generate timestamps
    struct timespec start;
    clock_gettime(CLOCK_REALTIME, &start);

    // Clear and open the file for writing
    FILE *file = fopen("temperature_data.csv","w");

    struct userStruct userData;
    userData.start = start;
    userData.outputFile = file;

    // Print the header at the top of the file first thing
    fprintf(file, "Time,Thermocouple-Temperature,Ambient-Board-Temperature\n");

    // Create the Phidget software object, hook in the event function, and open the object
    CPhidgetTemperatureSensorHandle device = 0;
    CPhidgetTemperatureSensor_create(&device);
    CPhidgetTemperatureSensor_set_OnTemperatureChange_Handler(device,
            TemperatureDataHandler, (void *) &userData);
    CPhidget_open((CPhidgetHandle)device, -1);
    result = CPhidget_waitForAttachment((CPhidgetHandle)device, 10000);
    if (result) {
        printf("No Device!\n");
        return 0;
    }

    // Set the thermocouple type and trigger (0 = record all data)
    CPhidgetTemperatureSensor_setTemperatureChangeTrigger(device, 0, 0);
    CPhidgetTemperatureSensor_setThermocoupleType(device, 0,
            PHIDGET_TEMPERATURE_SENSOR_K_TYPE);

    printf("Press Enter to end\n");
    getchar();

    CPhidget_close((CPhidgetHandle)device);
    CPhidget_delete((CPhidgetHandle)device);
    fclose(file);
    return 0;
}
Some highlights:
- Line 25 and 56: To create timestamps for the data being recorded, we use
clock_gettime()(a Linux-specific function) to accurately obtain the elapsed time.- Similar (but different) functions exist on Windows
- Lines 59: We start with a fresh, empty file with the same name each time, overwriting previous contents.
- Line 82-83: We used a K-type thermocouple. You need to change this line to your thermocouple type.
- Line 81: We set the sensitivity (trigger) to 0, to record all data. Setting a value above 0 will only record changes greater than or equal to that value.
Compile and Run
The process to compile this code differs from the one described on the Language - C/C++ page. You will need to link in both the Phidgets library (-lphidget21) and the Real Time POSIX library (-lrt) when compiling your code. If you have saved the C code in a file code.c, the gcc compiling command will be:
gcc code.c -lphidget21 -lrt
The Real Time library is required for the clock_gettime function in the C code above. Then, the executing instructions are the same as those described on the C/C++ Language page.
Putting it All Together
If you select your language of choice above and examine what the code does, you will probably find that it simply calls an event function to record data over and over. If you were to use a different Phidget, or different sensor, it will be a differently named event function and Phidget software object. But, many of the concepts remain the same, including:
- The method for obtaining time and writing time stamps with the data
- The method of opening and writing to a file
- The order of setup for the Phidget including creating, opening, attaching, and using. (For more detailed information on these steps, see our programming guide)
- The ability to analyze the data in a text format or in a spreadsheet format
Now that you have some running code, we go more in-depth on what it does. The code above saves the data from the Temperature Sensor Phidget into a Comma Separated Value file (*.csv). It will be named based on the code snippet you use and written into the directory where you run the code:
- C# code writes to "temperature_data_csharp.csv"
- Java code writes to "temperature_data_java.csv"
- Python code writes to "temperature_data_py.csv"
- C code writes to "temperature_data.csv"
Try running the code on a command line or in a terminal. For example, if you are using the Python code and have saved it to a file code.py, running it will give you something like this:
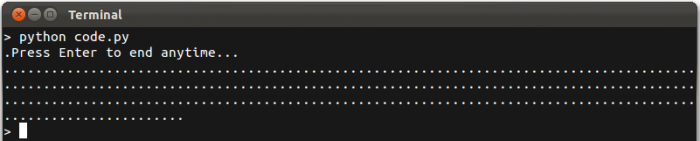
The other languages will look almost exactly the same. Each period "." indicates a data point being written to the file. After you have recorded what you want to record, press 'Enter' and the file will be finalized and the program will exit.
When we ran the program, we measured three different warm materials:
- We exhaled onto the thermocouple, exposing it to warm air
- We touched the thermocouple to warm skin
- We dipped the thermocouple into warm tea
These three events form the basis of the data we will work with here and in the analysis section below.
Most spreadsheet programs (Excel, Open Office) will automatically recognize a *.csv file as something they can open. You can use the spreadsheet program of your choice to open the *.csv file and look at the data you've recorded. Here, we use the program R to view and plot the data - it is free and available for many operating systems.
To import the data from the python program, we can start R on the command line with the command "R", and then import the temperature_data_py.csv data file with:
temp.data = read.csv("temperature_data_py.csv")
This import will automatically carry over the headers from the text file. Unlike other languages, the dot "." in R can simply be used as part of a variable name. The "accessor" function for accessing the slots within an object is the dollar sign "$". To plot the temperature data, you simply type:
plot(temp.data$Time,temp.data$Thermocouple.Temperature)
Or we can pretty it up with axis labels, lines instead of dots, and some colour with:
plot(temp.data$Time,temp.data$Thermocouple.Temperature,type="l",ylim=c(0,70),xlab="Seconds",ylab="Degrees Celsius",col="blue")
Which gives:
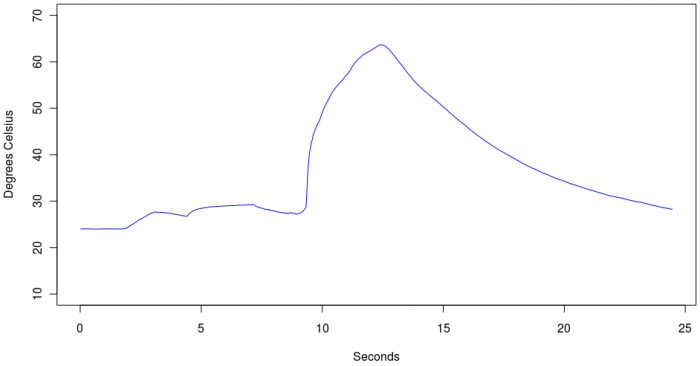
This temperature variation was obtained by touching the sensor to warm materials, and this is a good test to make sure your leads are hooked up correctly. The large spike in temperature is due to the thermocouple being immersed into hot tea. But if the leads were backwards, as we did with a second recorded series of the same materials, it will look something like this:
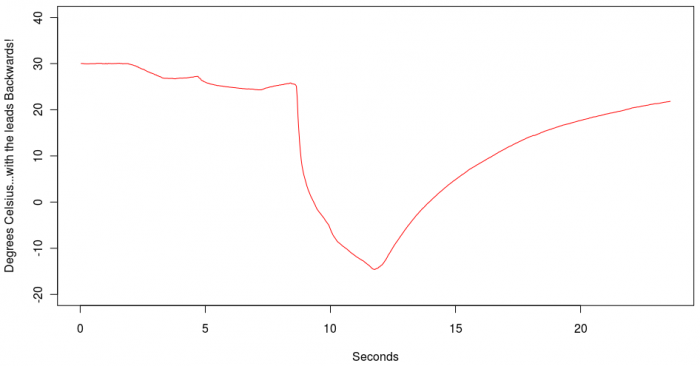
Since hot tea is not colder than -10C, this is a good indication that the leads are reversed. However, the ambient temperature at the start of the series is possible and not entirely unreasonable, so accidentally reversing the leads may only be discovered when objects of very different temperatures are measured.
At this point, you have successfully logged data from a Phidget to a text file which can also serve as a spreadsheet. If you want to learn more about how the data can be interpreted, and more about how to use your Temperature Sensor and thermocouple, read on. Otherwise, enjoy playing around with the sensor and logging data on your own!
Data Analysis
In this section, we use the data collected in the Putting it All Together section to examine how different materials provide different rates of heat transfer.
Matching Data With Reality
First, we'll set up a more complete plot of the data. To plot both the thermocouple temperature and the ambient board temperature, you can add things to your plot in R after the first plot command, including a legend in the upper left:
plot(temp.data$Time,temp.data$Thermocouple.Temperature,type="l",ylim=c(0,80),xlab="Seconds",ylab="Degrees Celsius",col="blue")
lines(temp.data$Time,temp.data$Ambient.Board.Temperature,col="lightgreen")
legend("topleft", lty=1, c("Thermocouple","Ambient"),col=c("blue","lightgreen"))
When we expand the window with the plot in it, we can clearly see the three hot materials - air from breath, skin, and hot tea:
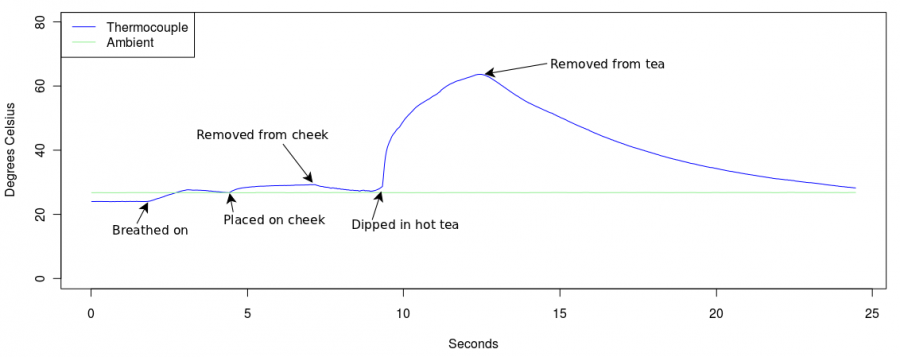
Accuracy and Error
Given that the ambient board temperature (green line) is about 2.5 C warmer than the thermocouple (blue line) before we have applied any heat or cold, you are probably already asking about the accuracy. The accuracy of our K-type thermocouple is 2 C. The board temperature sensor has its own accuracy. So in this case, we are not only comparing the thermocouple temperature to whatever the ambient air temperature is (which should be within 2 C of the blue line), we are actually comparing it to a second sensor. And that second sensor has its own error, and that error may even be in the opposite direction!
But this is for absolute temperature. If you are not as interested in how close the thermocouple data is to the actual, real-world temperature, but you are interested in detecting very small changes in temperature, you are in luck. Detecting accurate real-world temperatures is hard because it depends many factors, from the current slight temperature differences across the board to the sampling speed compared to the speed of change, and so on. But detecting temperature change given relative consistency of those factors is easy.
This is one of the fundamental challenges in measuring temperature electrically:
- It is easier to measure a difference in temperature than an absolute temperature
....By the way, if you are interested in measuring absolute temperature more accurately, and also change in temperature more accurately, check out Resistive Temperature Devices (RTDs), which you can use with the 1046 - PhidgetBridge 4-Input and resistor hookups such as our 3175 - Precision Resistor - 1K Ohm 0.1% (Bag of 4).....
To describe the precision with which a temperature sensor can detect absolute and relative changes in temperature, the error analysis is split into two parts: accuracy for absolute temperature, and resolution for relative change in temperature:
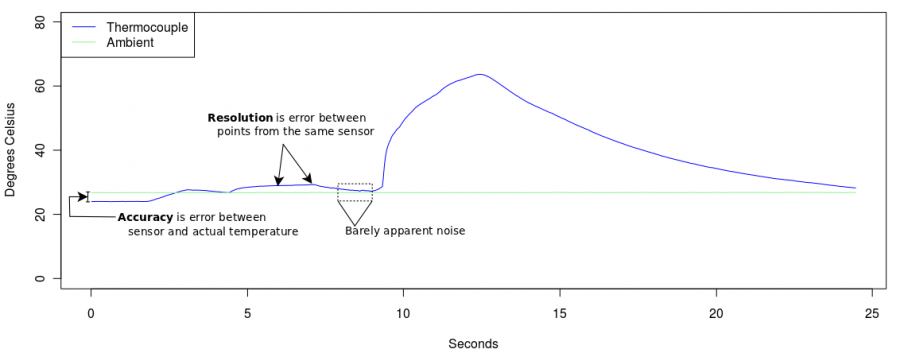
In addition, noise is random error which can be corrected for in a large data set, but not for an individual data point. Think of noise like static - it is a fairly predictable 'pattern' if you watch or listen to it over time, but precisely predicting one particular pixel or tone in a video or sound stream of static is impossible.
Material Heat Transfer
One of the interesting things about this experimental application is that you can see how the thermocouple measures temperature of different materials.
There are a few different types of materials in this data series - Liquid, air, and soft material. The type of material matters because the thermocouple must become the same temperature as the object it is measuring in order for the correct value to be measured. So a material which transfers its heat poorly to the metal tip of the thermocouple will need more time to produce an accurate measurement, whereas a material which can transfer heat quickly will need less time.
We can see the differences in time for the different materials used:
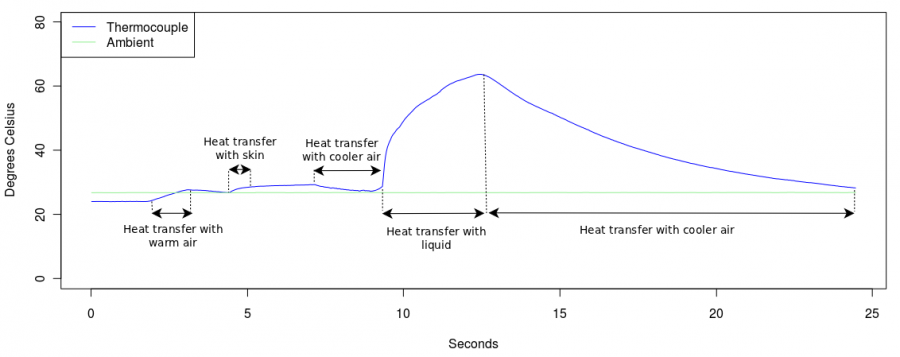
Most striking is probably the difference between heat transfer in liquid and in air. Air takes much longer to bring the thermocouple to its temperature than the liquid does. This is mostly because the air is less dense, and heat transfer occurs most efficiently by direct contact between surfaces, which are less dense in air than in liquid.
Try measuring different surfaces. You can place different materials in a low-heat oven (or dryer, depending on the materials) to warm them to the same temperature and then observe how fast the thermocouple can equalize with their temperatures. This will give you an idea of how long you will need to wait for equalization when measuring a new material which you intend to build your final system around.
Extra Credit
- As mentioned above, the thermocouple is a contact temperature sensor - it works by becoming the same temperature as the material it is touching. There was a sharp contrast between liquid and air. But what factors would affect the equalization time for different liquids? Different solids?
- If you have the 4-input Temperature Sensor, try using more than one thermocouple at the same time on the same material. Then use one thermocouple and move it to different points on the same material. The different thermocouples will probably read a slightly larger variation in temperatures than the single thermocouple. This is related to the accuracy-type error discussed above.