Accelerometer Guide
Accelerometers and Their Uses
Introduction
As the name implies, accelerometers are devices that measure acceleration. Knowing moment-to-moment accelerations in your system can be useful in tracking motion, orientation, and even vibrations in your system.
What the Readings mean
Accelerometers measure acceleration. As such, you might expect an accelerometer to measure the acceleration of the sensor relative to the space around it, and that if the sensor is standing still it should read 0g. This is not entirely accurate. On the earth’s surface an accelerometer that’s not moving will register a reading of 1G (9.81m/s), straight upwards. So what’s going on here? Accelerometers work by measuring the movements of small internal structures caused by accelerating the sensor in a particular direction. When an accelerometer is stationary on earth’s surface, the sensing part of the accelerometer (as with everything else) wants to fall at 1G towards the centre of the earth. However, it is being held up by the casing of the accelerometer by an equivalent 1G in the other direction. Thus, the equivalent measured acceleration is 1G away from the ground. The only time an accelerometer will register 0G in all directions is if it is in freefall in a vacuum.
Tilt Angle
This constant measuring of acceleration due to gravity makes accelerometers an excellent way to keep track of which way is up. If you want to track a tilt angle, accelerometers can be a very useful tool. Where available, you can use the Spatial object to get pitch and roll angles directly from the Phidgets libraries.
Tracking Movement
While it can be tempting to think it would be fairly straightforward to use an accelerometer to keep track of the position of an object over time, the problem of tracking absolute position with an accelerometer turns out to be hard enough that it falls outside of what we can recommend attempting without serious research.
Vibrations
Accelerometers can be used to measure the frequency and amplitude of vibrations. A decent accelerometer can be used to measure acceleration effects small enough to be imperceptible to humans, such as detecting seismic events, or measuring the resonant frequency of a building.
The range of frequencies and amplitudes of vibrations you can measure depend of the speed and noise level of the accelerometer. For best results, you will want to ensure your accelerometer has a data rate at least 4x faster than the frequency of the fastest vibrations you are interested in. You will also want to ensure the noise floor of your sensor is significantly smaller than the signal you expect.
High Frequency Vibrations
If you install your accelerometer on, for example, a piece of machinery that is strongly vibrating at frequencies faster than your accelerometer can measure, this can result in aliasing effects and offsets that will throw off your measurements. If you expect the structure you are measuring is likely to produce high frequency vibrations, we recommend isolating your accelerometer from these vibrations using some sort of shock mount. These are typically simple parts made of rubber, elastics or springs, designed to dampen the vibrations that can make it to your sensor.
Qualitative Measurements
On the other end of the spectrum, accelerometers can be used for much more basic purposes, such as detecting the fact that an object is moving, or that it’s met a sudden stop. Installed in a car, one might use an accelerometer to consider if one driver drives more aggressively than another. These types of applications that are only interested in getting a general characterization of movement will likely not need high-end sensors to make broad generalizations of the types of movement.
Choosing an Accelerometer
The accelerometer or spatial device you use in your application will depend on how accurate certain aspects of your measurement need to be. To simplify the decision, we can narrow this down to various kinds of applications:
| Application | Recommended Phidget |
|---|---|
| Vibration Measurement | MOT0100 PhidgetAccelerometer |
| Navigation | MOT0110 PhidgetSpatial Precision 3/3/3 |
| Gestures and Qualitative Effects | MOT1102 Spatial Phidget |
Demonstrations Using the Control Panel Example
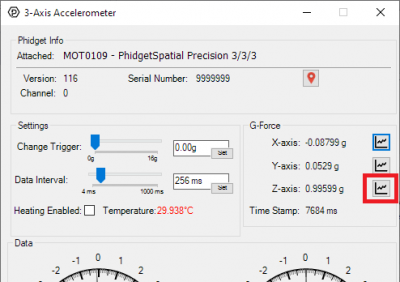
To more clearly see the effects we have been describing, we can use the Control Panel example for your Phidgets Accelerometer to do some demonstrations.
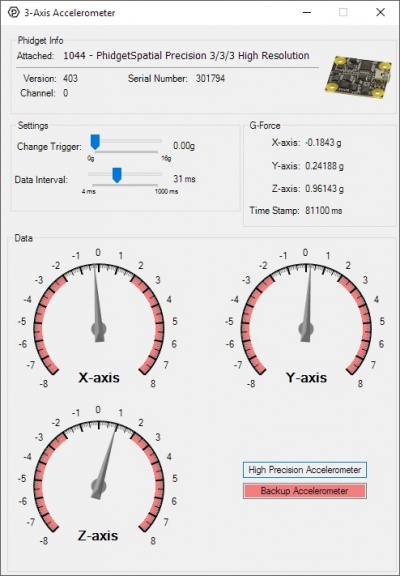
Once your example is open, we recommend sliding the DataInterval slider all the way to the left for the highest data rates from your sensor.
If your sensor supports temperature stabilization, a checkbox will be available to enable heating. For best results, check the box to enable heating and wait for the temperature measurement to turn green.
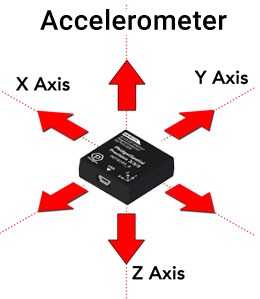
With the example open, and the DataInterval set as fast as the sensor will go, try moving the sensor around and observe the dials on the example. Each dial corresponds to the acceleration in one axis of movement.
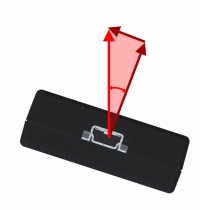
To better visualise this, place the sensor right-side up and flat. You should see the Z axis give a reading of +1. Flip the device over, and Z will read -1. If you instead point the cable at the ground, Y will read -1, with X and Z reading 0. Flip the device so that the cable is pointing skywards, and Y will read 1. Likewise with X: pointing the cable at yourself, right-side upwards will give +1, left -1.
By rotating the sensor slowly between these axes, you can see how the reading shifts between these axes. In this way, trigonometry can be used to calculate the angle of the device relative to the ground using the strengths of all the axes, so long as the device is not in motion. This behaviour is used in the Spatial object to calculate pitch and roll of the sensor.
Similarly, as you move the sensor around, the axes will measure the overall acceleration in their corresponding directions, which can be used to gain a general sense of the sensor’s movement. Of course, if the sensor is rotating at all, the acceleration data alone can’t tell us much more than the fact that the sensor is moving, but that’s a topic for another time.
Vibrations
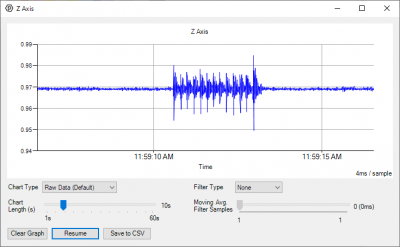
To get a sense of just how sensitive your accelerometer can be to vibrations, you can open the graphing tool for the Z-axis.
From the time graph that shows by default, you can see the readings from the axis over time. By placing the sensor on my desk, I can see the vibrations caused by my typing on the keyboard as wider sections of the graph. You can try this for yourself by placing the sensor on a flat surface, and tapping the surface somewhere else.

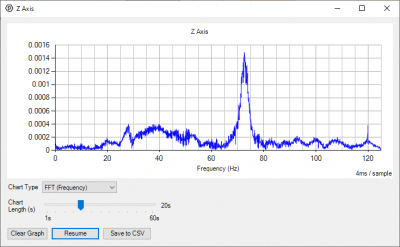
Now comes the really cool part: if you change your graph to FFT mode, you can see a readout of all the frequencies measured by the sensor. We won’t cover the specifics of how Fourier transforms work here, but it’s applying math to the readings that turns time-based signals into a collection of frequencies that make up the signal.
Note: Fourier transforms are not natively available from the Phidgets libraries outside of the graphing function. If you want to use frequency data in your program, we recommend finding a Fourier transform library for your programming language.
By tapping my desk in Fourier transform mode, my graph shows a peak between 70-75Hz, which would be the resonant frequency of my desk.
The same can be done on the X and Y axes, to see the components of vibration for all axes. Interestingly, if you solidly mount your accelerometer to a vibrating surface, you can calculate how far that surface is moving in each direction by integrating the motion over time, though the specific calculations are outside the scope of this document.
The number at the far right of the graph is the highest frequency the device is mathematically capable of measuring. Any frequency components higher than this will result in aliasing. In a broad sense, the math is unable to distinguish between higher frequency signals and those on the graph, making higher frequency signals look like some other frequency that does fit on the graph. The specifics of how this works are outside the scope of this document, but the main takeaway is that if you are interested in measuring the frequency of vibrations, the vibrations in your system that make it to your sensor should be limited to those less than the maximum frequency measurable by your sensor.