|
Notice: This page contains information for the legacy Phidget21 Library. Phidget21 is out of support. Bugfixes may be considered on a case by case basis. Phidget21 does not support VINT Phidgets, or new USB Phidgets released after 2020. We maintain a selection of legacy devices for sale that are supported in Phidget21. We recommend that new projects be developed against the Phidget22 Library.
|
Live Data Graphing
The project described here is for using various Python libraries for creating a MATLAB-like graphing program, which scrolls the graph in real time.
Practical concepts covered are (click on links to see other projects on that topic):
|
|
| Time: | About one day of work installing libraries and adapting code |
| Special Needed Tools: | None |
| Materials and Phidgets: | One Phidget Thermocouple board, USB cable, and thermocouple |
As with any of our described projects, Phidgets takes care of the electrical component design. Here, we show how to collect the data and display it in a slick manner.
If you just want to log data and save it to a file, you probably want to start with our Data Logging With a Thermocouple application guide, which does exactly that. This application guide focuses on the graphical display of data over time.
Introduction
This project is a live GUI graphing application that displays data in real time, in a scrolling graph. This type of application - written in Python - can capture low-speed data and display it, and hence is a good alternative to MATLAB graphics when you wish to use events in your code. Python also offers fast numerical processing via the NumPy library and so can be a numerical alternative to MATLAB as well.
Although we use a Phidget thermocouple board (such as the Phidget 1051 1-Thermocouple Board or the Phidget 1048 4-Thermocouple Board), this code can be adapted for nearly any Phidget, as shown by the use of it for a Phidget DC Motor Controller in the Extra Credit section.
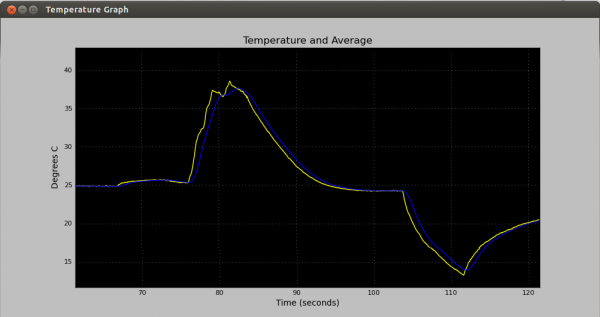
The GUI program has automatic axes scaling and scrolling as this smaller-than-reality (and low resolution) animated GIF shows:
Phidgets
To use the code in this guide as-is, you will need to have a Phidget Temperature Sensor and a thermocouple.
Some example ways to set this up are:
| Example Setup | Strengths |
|---|---|
| Basic thermocouple setup | |
| Ability to measure multiple points | |
| Wide temperature range thermocouple |
Of course, these are only examples - any thermocouple with either Temperature Sensor Phidget board will work.
We will log data from thermocouple port 0. On a one-input board, this is the only thermocouple input; on a four-input board, make sure you have a thermocouple plugged in to sensor port 0:
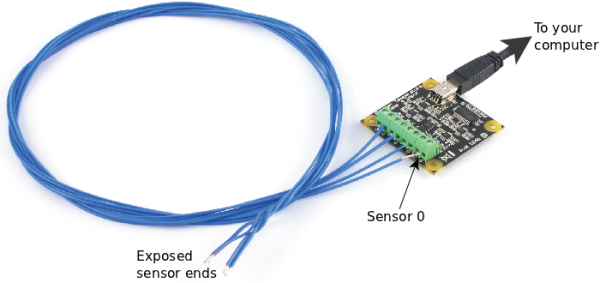
Once you have your Phidget assembled with a thermocouple in Port 0, continue on to installing libraries.
Setting up and Installing Libraries
The libraries used here are primarily Python libraries. This makes them a good alternative to the graphics in MATLAB. Python and MATLAB share many commonalities, such as:
- They are interpreted languages
- They have good online documentation and a large user base
- They run on all major operating systems, without much code difference
- You can use them to write code to do matrix analysis, or GUI display
However, there are a few advantages to using Python, especially with Phidgets, instead of MATLAB:
- The Phidget API in MATLAB is essentially using the C library calls from MATLAB. In Python, you can make calls directly.
- You can listen to and use events in Python, but not in MATLAB.
- Python is free.
- Python has an extensive number of libraries to interface your Phidget with other programs, such as R, GRASS and PostGIS, Octave (free MATLAB), online CGI applications, and more.
In this guide, we will use some of the GUI and matrix/vector math libraries in Python. These will allow us to create a full application which graphs, scales, exports data, exports images, and more in under 350 lines of code.
Libraries Needed
First, make sure you have followed the Getting Started guide for your Temperature Sensor, found in its user guide.
To run the code in this guide, you will need the following installed:
- Python
- The Phidget Libraries installed for your operating system
- The Phidget Python module installed and tested, as described on our Language - Python page
- WxPython
- Matplotlib
- NumPy and SciPy (these provide much of the the matrix and array functionality in MATLAB)
Installing hints by operating system are below.
Windows and Mac OS X
First, figure out which version of Python you want to download.
Note that as of the writing of this guide, there was only one version of Python which would run NumPy/SciPy, Matplotlib, and WxPython, and it is 32-bit:
- WxPython runs with Python 2.6 or 2.7
- Matplotlib runs with Python 2.X (2.4 or later, but not 3), and then only 32 bit
- NumPy seems to prefer Python 2.6, on reports from our customers.
However, NumPy 1.5 release notes says it is compatible with later Python 2.X versions, so you may be able to get it to work.
So as of this writing, you'll want to download Python 2.6, 32 bit version.
If this has changed, on Windows and Mac, it can be quite obtuse to figure out which versions you need for all of the software. If you can use a 32-bit version, the 32-bit packages from Enthought Python are free and include all of the needed libraries except the Phidget components. They also offer 64-bit versions for a subscription as of this writing, but you must do your own research there as we are not affiliated with them. You can also try Python(x,y), another option to get all of the libraries installed on a non-Linux system.
Once you have the right version of Python installed, you can install the Phidget libraries as discussed in the Linux section of our Language - Python page.
Linux
To install these libraries on Linux, it usually suffices to do:
sudo apt-get install python python-wxtools python-matlibplot python-numpy
And then you can install the Phidget libraries as discussed in the Linux section of our Language - Python page.
Algorithm
The algorithm is stripped down to:
- A single timer which re-scales and re-draws the plot (i.e. the GUI), and
- A Phidget event function which writes data to the array that gets drawn
For simplicity here, and because only one thread is ever writing to the data array, mutual exclusion is not used. This can create interesting background behaviour, as discussed in the extra credit Mutual Exclusion section below.
GUI
The best way to learn what the GUI does and how it works is perhaps to refer to the code itself and play with it. But we offer some explanation here for the back end and for the setup and scaling of the graph.
Back-End Rendering
To render graphics in Python, we simply pass commands to the back-end. In this case, we'll be passing commands to matplotlib, which will in turn pass its commands to the GUI back-end. Hence, we import both WxPython (our backend) and matplotlib at the same time:
import matplotlib       # Provides the graph figures
matplotlib.use('WXAgg') # matplotlib needs a GUI (layout), we use wxPython

from matplotlib.figure import Figure
from matplotlib.backends.backend_wxagg import FigureCanvasWxAgg as FigCanvas
After setting up the main structure for the GUI (see the code for plot layout, etc), the actual drawing that occurs, which makes the graph scroll - happens via a timer. This timer triggers a re-draw of the canvas (via the onRedrawTimer() function). Here is where we attach the timer to the redraw function:
# This times fires every 100 ms to redraw the graphs
self.redrawTimer = wx.Timer(self)
self.Bind(wx.EVT_TIMER, self.onRedrawTimer, self.redrawTimer)
self.redrawTimer.Start(100)
Then, the redrawTimer function can simply be:
def onRedrawTimer(self, event):
    self.drawPlot()
And in drawPlot(), we can read the array, set the axes, and draw it. Because the data is updated by Phidget events, we just grab whatever is in the array and not worry about doing the updating of the data itself in the GUI. If a new point was added
In the attached code, we also have a handler in onRedrawTimer to catch exceptions for when the array lengths do not match (i.e. we are reading the arrays when they are being written to). This is discussed more in the Mutual Exclusion section below.
Set Up and Scaling
The colour and style of the lines and plot are handled in an initialization function once - i.e. initPlot(). Then those settings are remembered and activated within matplotlib when we call the set_data and draw functions later for every redraw. For example, the yellow temperature line style (the blue line is a running average) is set in initPlot() as:
self.plotData = self.axes.plot(
    self.data,
    linewidth=1,
    color=(1, 1, 0),
    )[0]
This is also the line where the actual data array connected with the line - i.e. self.data - gets attached for the first time.
Then the drawPlot() function (via the redraw timer) draws that line with:
self.plotData.set_data(np.array(self.time), np.array(self.data))
self.canvas.draw()
The only data that gets drawn visually to the user is the data between the x/y minimum and maximum values on the plot. So we can get the plot to scale automatically in the vertical direction by setting the axes to the limits of the data, plus a buffer - this happens in drawPlot() right before the actual refresh draw occurs.
We can also get the x-data to scale the same way, such that the far right side of the x-axis always matches the last point in our data. If the x-axis is always a fixed width, this makes the graph appear as if the data are scrolling through it. You can play around with these parameters to make the vertical axis fixed, or the x-axis expand as data is collected, or any number of display options.
Data
The data for a temperature sensor is straightforward as you simply have to display the sensor value. Other Phidgets, such as the example below using a Phidget Motor Controller, need various levels of calculation prior to display.
The main complexity here is creating a data array which remains the same size. If we just keep adding (appending) data to an array
If you have a normal desktop-power computer, writing to a data array within your event handling function should work fine. In this example, the GUI components put a large load on your processor, so if your computer is not relatively fast, you might have to set up a data polling method rather than using events. But here, we attach the function temperatureChanged to the Phidget data handler:
thermocouple.setOnTemperatureChangeHandler(temperatureChanged)
And then our temperatureChanged() function records the time and further calls an updateTemperature() function with the time and temperature. The updateTemperature() function looks like this:
def updateTemperature(self,temperature,time):

    avgSum = 0
    window = self.avgOver if self.avgOver < len(self.data) else len(self.data)
    for a in range(window):
        avgSum = avgSum + self.data[(-1 * a)]
    avgSum = avgSum / window
    self.avgData.append(float(avgSum))

    self.data.append(float(temperature))
    self.time.append(float(time))
    self.totalTime = time

    if len(self.data) > self.maximumArray:
        global looped
        if not looped:
            print "Starting re-use of graph arrays for efficiency..."
            looped = True
        self.time.pop(0)
        self.avgData.pop(0)
        self.data.pop(0)

    self.fileTime.append(float(time))
    self.fileTemperature.append(float(temperature))
- Lines 3-7 calculate the average. This is over the latest data set of length
window. - Lines 8-12 appends all the data of interest to each array.
- The average goes onto
self.avgData - The time goes onto
self.time - The temperature goes onto
self.data
- The average goes onto
- Lines 14-21 checks to see if the array exceeded our maximum.
- If it does, the first data points are popped of and thereby discarded.
- Lines 23-24 save both time and temperature again. The
fileTimeandfileTemperaturevariables save all data to export to a text file later if desired.
And that's it for recording data. In this way, all data is saved in the file variables, and a moving array of fixed length handles the data to be shown on the graph.
Using a fixed-width moving array makes the code run almost forever. The file variables get longer and longer, but nothing is done with them until a text file is written. Not using a fixed-width array for the displayed data, however, will eventually cause enough lag in the GUI redraws to slow - and then stall - the graphical output.
Putting it All Together
Ready to run the code itself? Here it is:
You can run the code as described by operating system on the Language - Python page.
Extra Credit
Exporting Data
If you run the program, you may note that there is a File menu that appears in the normal upper menu location. The actual location depends on your OS - it may be on the upper top bar on Mac or Linux Unity.
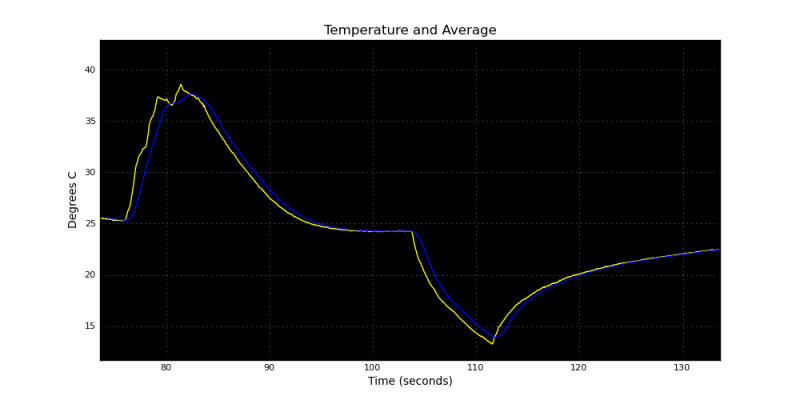
The File menu has two options of interest here - Save as Image, and Save as CSV. If you download and read the code, you'll see the functions (near the bottom of the file) that provide the drive behind this, and they're quite simple. This allows you to save all of the current data in a CSV, or, as an image, the part of the data on the current graph:
Extending with Other Phidgets and Widgets
Using the code as a place to start, you don't just have to have one scrolling graph, you can have many. You can also add buttons, sliders, input boxes, etc. and process on them to drive your Phidget and see the output.
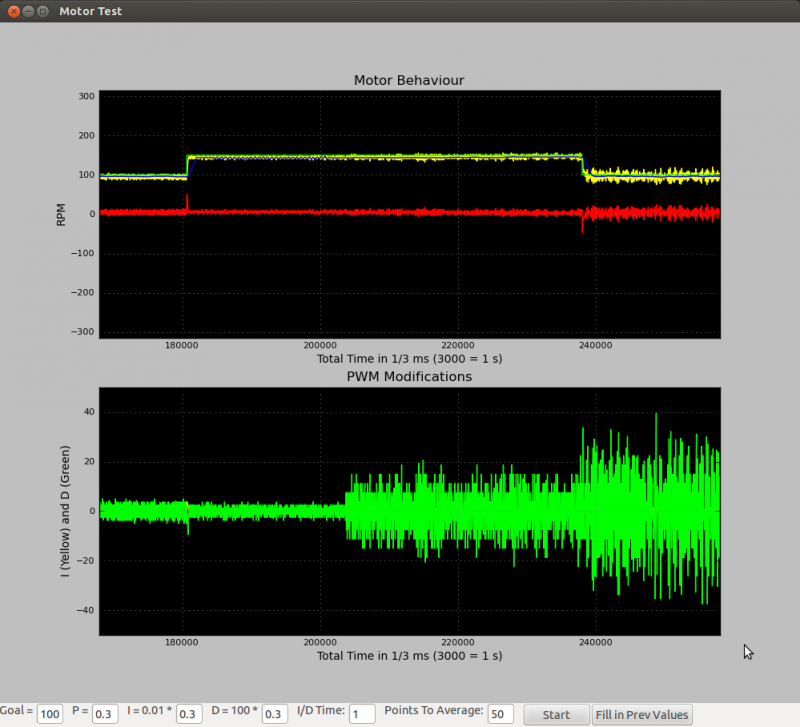
For example, here is the live graph program adapted to control a DC motor for testing control loops - in this case, a PID (Proportional, Integral, Derivative) constant rotation loop. The inputs at the bottom allow the loop to be changed, and the two graphs allow both the state of the motor, and the state of the control loop, to be displayed at the same time:
Mutual Exclusion
We don't include mutual exclusion in the attached code. The best way to implement this code (and the most safe, for a commercial application) would be to write to the data array in a thread which communicates with the GUI thread that reads it. Reading would not be allowed until the writing thread had completed writing an entire event.
Without this mutual exclusion, there is a chance that the "draw" thread will trigger and the data from the Time or Data array without the other array matching it in length. This array mismatch error can be caught, and that draw event skipped. This is an annoyance, but will not mess up the data arrays themselves, because only one thread is writing to them (the event thread from the Phidget).
If, however, you were to deploy this code long-term, or wanted more than one function to write to the arrays, you would need to implement some sort of mutually exclusive method of writing to the data array.