1046 User Guide
Getting Started
Welcome to the 1046 user guide! In order to get started, make sure you have the following hardware on hand:
- 1046 PhidgetBridge
- USB cable and computer
- something to use with the 1046 (e.g. load cell, RTD , wheatstone-bridge type sensor, etc.)
Next, you will need to connect the pieces:
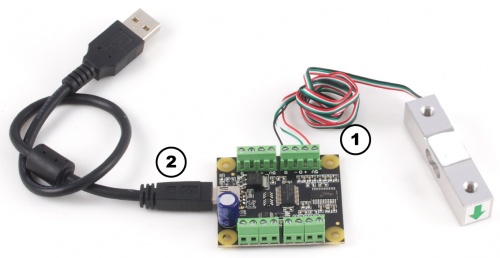
- Connect your sensor to the PhidgetBridge according to the wiring specified on the sensor's product page or datasheet. See the technical section to learn how to hook up resistive sensors such as RTDs.
- Connect the PhidgetBridge to your computer using the USB cable.
Now that you have everything together, let's start using the 1046!
Using the 1046
Phidget Control Panel
In order to demonstrate the functionality of the 1046, the Phidget Control Panel running on a Windows machine will be used.
The Phidget Control Panel is available for use on both macOS and Windows machines.
Windows
To open the Phidget Control Panel on Windows, find the ![]() icon in the taskbar. If it is not there, open up the start menu and search for Phidget Control Panel
icon in the taskbar. If it is not there, open up the start menu and search for Phidget Control Panel
macOS
To open the Phidget Control Panel on macOS, open Finder and navigate to the Phidget Control Panel in the Applications list. Double click on the ![]() icon to bring up the Phidget Control Panel.
icon to bring up the Phidget Control Panel.
For more information, take a look at the getting started guide for your operating system:
Linux users can follow the getting started with Linux guide and continue reading here for more information about the 1046.
First Look
After plugging the 1046 into your computer and opening the Phidget Control Panel, you will see something like this:
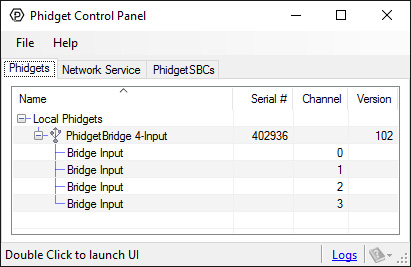
The Phidget Control Panel will list all connected Phidgets and associated objects, as well as the following information:
- Serial number: allows you to differentiate between similar Phidgets.
- Channel: allows you to differentiate between similar objects on a Phidget.
- Version number: corresponds to the firmware version your Phidget is running. If your Phidget is listed in red, your firmware is out of date. Update the firmware by double-clicking the entry.
The Phidget Control Panel can also be used to test your device. Double-clicking on an object will open an example.
Bridge Input
Double-click on the Voltage Ratio object, labelled Bridge Input, in order to run the example:
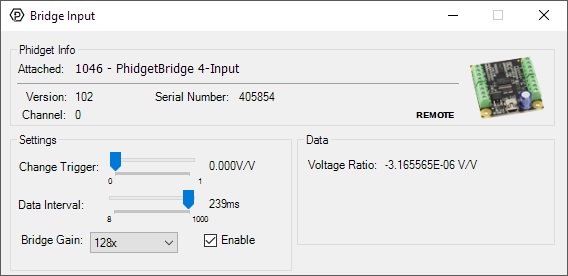
General information about the selected object will be displayed at the top of the window. You can also experiment with the following functionality:
- Modify the change trigger and/or data interval value by dragging the sliders. For more information on these settings, see the data interval/change trigger page.
- Toggle the Enable checkbox in order enable/disable the 1046.
- Select a gain from the Bridge Gain drop-down menu. For more information about choosing the best gain, see the technical section.
Technical Details
How to Calibrate the Bridge
We have observed a 1.5% difference between a 1x gain and an 8x gain. This may require that each system (1046 and sensors) be calibrated as a whole. For maximum accuracy, decide on, and keep with a chosen gain before calibrating the system.
Expensive sensors will ship with a certificate of calibration specifying, often in mv/V, how the sensor responds to stimulus. Less expensive will have to be calibrated, which requires having at least two points where you know accurately what is being measured. In the case of weight measurement, this would be a known force or weight.
Record the output from the 1046 at one known point, and at a second known point. It helps if the two values are reasonably far apart. Use the values to make a linear equation to convert the 1046 output in V/V (called X) to the appropriate unit you are measuring (called Y). Two calibration coefficients (a,b) set the slope and offset for the calibration: (Y = aX + b). It’s possible to use more than two points, if available.
The C# VoltageRatioInput example shows how to do a 2-point calibration and apply the coefficients programmatically.
Gain Setting vs. Resolution
We report the measured voltage in a ratiometric unit known as V/V. This is how the maximum range of sensors that use strain gauges is usually specified. V/V is the output value in V of the measured sensor, scaled for a 1V sensor supply voltage. This value will correspond to the physical quantity that the sensor is measuring, regardless of the actual voltage supplied to the sensor.
| Gain | Resolution | Range |
| 1 | 119 nV/V | ± 1000 mV/V |
| 8 | 14.9 nV/V | ± 125 mV/V |
| 16 | 7.45 nV/V | ± 62.5 mV/V |
| 32 | 3.72 nV/V | ± 31.25 mV/V |
| 64 | 1.86 nV/V | ± 15.625 mV/V |
| 128 | 0.93 nV/V | ± 7.8125 mV/V |
When choosing the Gain setting, it's best to use the highest gain possible that can still measure the full range of your sensor. For an individual unit, you can apply the maximum stimulus to the sensor, and ensure the voltage ratio reported is well within the range for the gain setting you have chosen. If many units are being deployed, it’s best to consult the data sheet for the strain gauge and look for maximum offset.
Some wheatstone bridges, most often those produced from silicon and used in pressure sensors, will have a very wide offset, and large manufacturing variation in the offset. This will restrict the gain to lower settings, particularly if the application must support a number of deployed systems with the expected variation. Fortunately, the very high precision electronics used in the 1046 means that in many application, higher gain is not necessary to get adequate accuracy and resolution.
Connecting your Strain Gauge/Load Cell
Load cells are pressure sensors that can be used with the 1046. For more information, see our Load Cell Primer.
If no documentation is available for your strain gauge, it’s possible to use a multimeter to determine how to connect it, provided there are no electronics in the sensor. First, measure resistance between the 4 wires. There are 6 combinations - two combinations will have a resistance 20-40% higher than the other four. Choose one of these high-resistance combinations, and wire it into 5V and G on the 1046. Connect the other two wires into +/-. Apply a load, if the V/V responds in the opposite way to your expectations, flip the +/- wires.
Measurement Considerations
The 1046 is designed to measure voltages as a ratio of the supply voltage - it’s not practical to make measurements of absolute voltages with this product.
For maximum accuracy, all wires from the 1046 to the sensor should be the same length and thickness. Changes in temperature will change the resistance of the wires - if they are all the same, the errors will cancel out.
Each bridge input can be powered down, reducing power consumption with 1046 sensors, and useful for reducing heating of sensors, which can introduce errors.
Changing the Data Rate
Using a slower sampling rate will reduce the noise in the measurements dramatically. The noise figures are specific to individual applications and sensors. The lowest noise level achievable is 5nV/V RMS.
Measuring Resistive Thermal Devices (RTD)
Using a Wheatstone Bridge
A Wheatstone bridge is the classic method of measuring unknown resistances, and requires three resistors of known values. It uses the current in each leg of the bridge to create a voltage differential between both voltage dividers. Using the voltage differential and the three known resistors, the resistance of the fourth resistor can be determined.
To determine the resistance of the RTD, the following formula can be used:
![R_{RTD} = \frac{R_3 \times [R_2 + V_B \times (R_1 + R_2)]}{R_1 - (R_1 + R_2) \times V_B }](https://wikimedia.org/api/rest_v1/media/math/render/svg/f9b5eaa5340732e841a084db3919b85e2ae44eb0)
Where is the Bridge Value given by the PhidgetBridge (in mV/V) , and , and are the resistances of the known resistors.


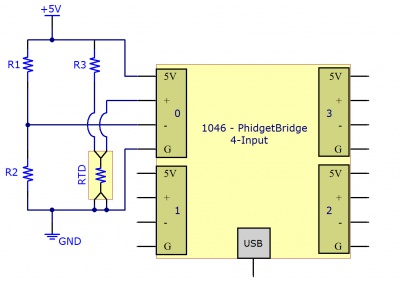
Using a Voltage Divider
The alternate method requires only two resistors. This reduces the amount of error that can be introduced into the system due to resistor tolerances. A voltage is applied to the two resistors and the RTD in series. The voltage drop across the RTD is measured. Using the voltage drop and the values of the two resistors, the resistance of the RTD can be determined.
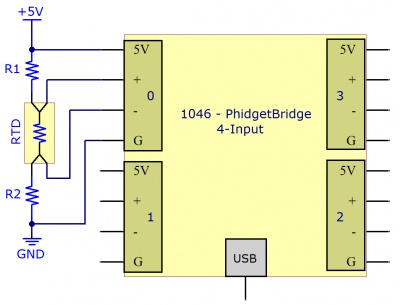
To determine the resistance of the RTD, the following formula can be used:

Where is the Bridge Value given by the PhidgetBridge (in mV/V) , and and are the resistances of the known resistors.
Getting Higher Accuracy
In order to get the highest accuracy from the RTD, consider the following:
- Use resistors with a high degree of tolerance. There will be less variability in the manufacturing of 0.1% resistors when compared to 1% resistors.
- Measure the known resistors with an ohmmeter. By obtaining the most accurate measurements for the known resistances, the formula will result in a more accurate measurement of the RTD.
- Use a moving average when obtaining the Bridge Value to reduce the amount of noise in the measured signal.
- Estimate or Measure the resistance of the +5V and GND wires between the RTD and the 1046 PhidgetBridge. Add this resistance to the two resistors.
- Turn off the power to the RTD (by disabling the channel on the PhidgetBridge) to reduce self-heating of the RTD.
- By using higher resistor values (> 1 Kilo ohm), there will be less self-heating of the RTD, but the resolution of the measurement will be reduced somewhat. We recommend 1 Kilo Ohm resistors as a reasonable trade off.
What to do Next
- Programming Languages - Find your preferred programming language here and learn how to write your own code with Phidgets!
- Phidget Programming Basics - Once you have set up Phidgets to work with your programming environment, we recommend you read our page on to learn the fundamentals of programming with Phidgets.